


Okamura (TSE:7994) caught income investors' attention after its board approved an interim dividend of ¥52.50 per share, slightly above the previous year and funded entirely from retained earnings.
Okamura's stock has tracked a softer patch recently, with the share price at ¥2,238 after a 1-day share price return of 1.82%, while the 30-day share price return declined 3.28% and the year-to-date share price return eased 3.66%. Over a longer stretch, momentum looks steadier, with a 1-year total shareholder return of 4.36% and a 5-year total shareholder return of 75.82%. This indicates that investors who stayed invested have been rewarded even as near term sentiment cools around the latest dividend move.
Scan beyond Okamura and line up other income ideas with solid fundamentals using our hand picked 27 dividend fortresses as a starting universe.
That richer interim payout and mixed recent share performance put Okamura at an interesting crossroads. Is most of the shareholder return story already reflected in the ¥2,238 price, or is there still meaningful potential upside?
Price-to-Earnings of 10.2x: Is it justified?
On simple valuation terms, Okamura looks inexpensive, with a P/E of 10.2x at a ¥2,238 share price compared with both its peers and an estimated fair level. That gap suggests the market is pricing the stock more cautiously than the underlying fundamentals and internal valuation work might imply.
The P/E ratio compares the current share price with earnings per share. For a business like Okamura that generates profits and pays a 4.69% dividend, this metric gives a quick read on how much investors are willing to pay for each unit of current earnings.
Okamura is assessed as good value on several fronts. The current 10.2x P/E is below an estimated fair P/E of 15.3x, and it also sits well under the peer average of 17x and the broader JP Commercial Services industry average of 13.4x. Taken together, these figures indicate that the market is assigning a lower earnings multiple than both a fair value model and sector comparables suggest it might support if sentiment were different.
Explore the SWS fair ratio for Okamura.
Result: Preferred multiple of 10.2x price-to-earnings (UNDERVALUED).
Still, Okamura faces real pressure if Japan-focused demand for office and commercial environments cools, or if its logistics systems segment delivers weaker than expected orders.
Find out about the key risks to this Okamura narrative.
Another view on Okamura’s value
The P/E comparison paints Okamura as inexpensive. A different method tells an even stronger story. Our DCF model points to a future cash flow value of ¥6,275.59 per share versus the current ¥2,238 price, which implies a very large gap. Is that a genuine opportunity or simply model risk showing through?
Look into how the SWS DCF model arrives at its fair value.
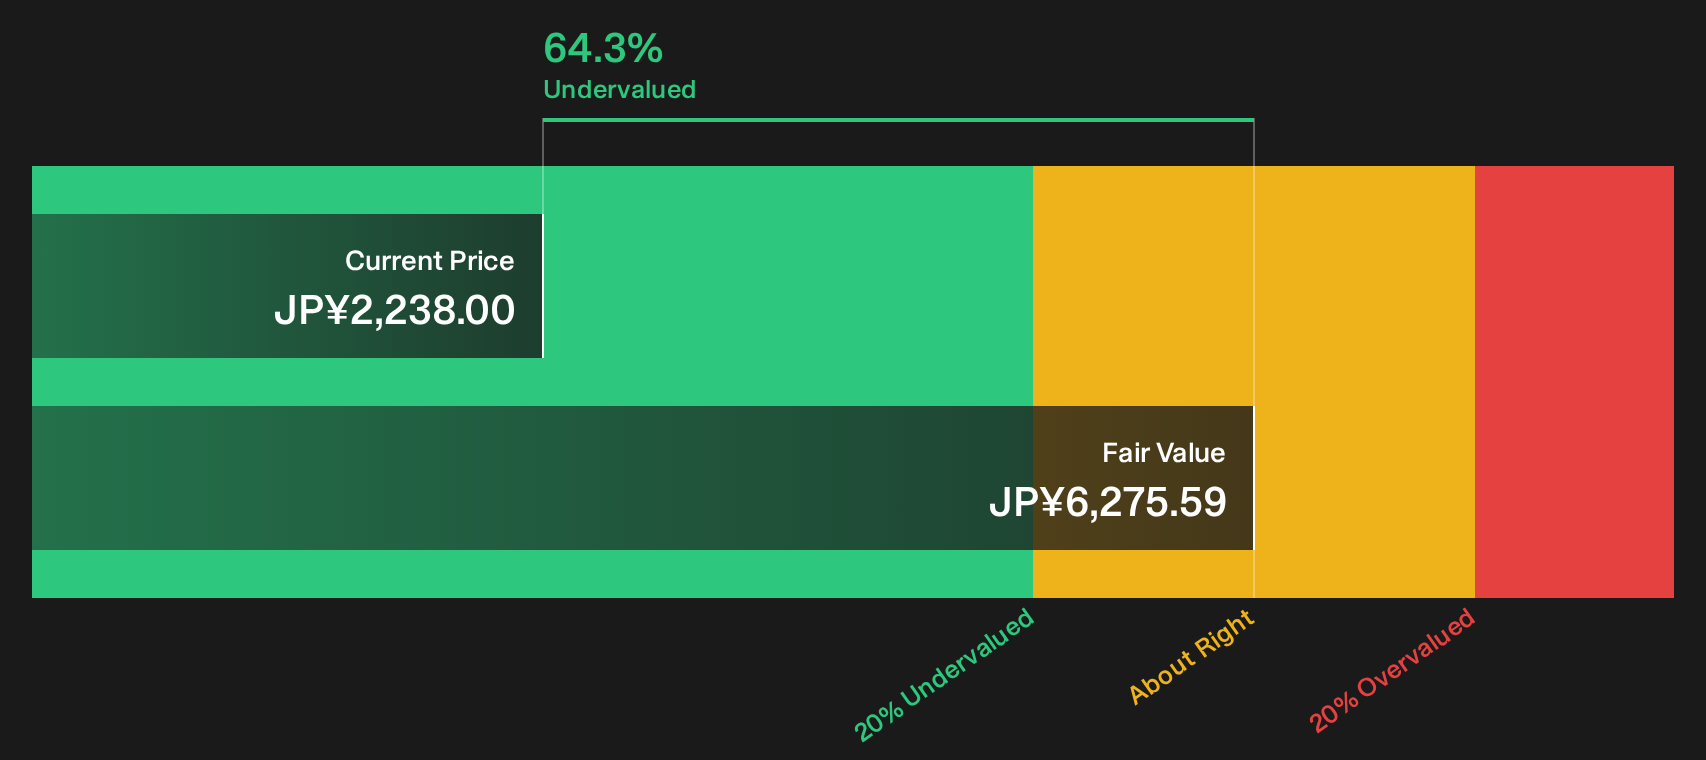
Simply Wall St performs a discounted cash flow (DCF) on every stock in the world every day (check out Okamura for example). We show the entire calculation in full. You can track the result in your watchlist or portfolio and be alerted when this changes, or use our stock screener to discover 13 high quality undervalued stocks. If you save a screener we even alert you when new companies match - so you never miss a potential opportunity.
Next Steps
Sentiment around Okamura is mixed on the surface. However, the underlying data tells its own story. Act while the facts are fresh and weigh the balance of risks and positives for yourself, starting with the 5 key rewards.
Looking for more investment ideas beyond Okamura?
Do not stop your research with Okamura alone. Use the Simply Wall St screener to widen your opportunity set and spot setups that match your own risk and income preferences.
- Target potential mispricing by scanning a curated universe of companies that screen as quality yet underappreciated using the 13 high quality undervalued stocks.
- Prioritise resilience by focusing on businesses with strong financial footing through the list of solid balance sheet and fundamentals (21 results).
- Hunt for lesser known prospects with robust fundamentals and room for discovery via the 74 high quality undiscovered gems.
This article by Simply Wall St is general in nature. We provide commentary based on historical data and analyst forecasts only using an unbiased methodology and our articles are not intended to be financial advice. It does not constitute a recommendation to buy or sell any stock, and does not take account of your objectives, or your financial situation. We aim to bring you long-term focused analysis driven by fundamental data. Note that our analysis may not factor in the latest price-sensitive company announcements or qualitative material. Simply Wall St has no position in any stocks mentioned.
Have feedback on this article? Concerned about the content? Get in touch with us directly. Alternatively, email editorial-team@simplywallst.com