


Seadrill (SDRL) just locked in a series of new offshore drilling contracts and extensions across Indonesia, Malaysia, Angola and the U.S. Gulf, giving investors clearer visibility on future rig utilization and contracted revenue.
That contract news comes on top of a strong run in the Seadrill share price, with a 1 day share price return of 4.28% and a 7 day share price return of 8.67%. This has contributed to a 40.20% year to date share price return and a 67.29% 1 year total shareholder return, which indicates building momentum rather than a short term spike.
Compare Seadrill’s contract driven momentum with other offshore and energy players by screening for 43 power grid technology and infrastructure stocks that could benefit as global demand for reliable energy infrastructure stays in focus.
After this contract surge and sharp share move, the real tension is simple: Does Seadrill’s fair value line up closer to today’s price or to the wide gap implied by analyst targets and intrinsic value estimates?
Most Popular Narrative: 9% Undervalued
On the most followed view, Seadrill’s fair value sits at $54 per share compared with the latest close at $49, so the gap now hinges on how the backlog and free cash flow story plays out over the next few years.
The shift from heavy project spending on reactivations and reacceptances toward lower capital expenditure guidance of US$200 to US$240m, alongside refinancing at lower coupons and an extended share repurchase authorization, points to an inflection toward stronger free cash flow and potential improvement in net margins and per share earnings.
See why 10 investors see Seadrill as 9% undervalued.
Result: Fair Value of $54 (UNDERVALUED)
Still, Seadrill’s rich P/S multiple and history of weaker margins and negative free cash flow mean any stumble on contracts or utilization could quickly pressure the story.
Find out about the key risks to this Seadrill narrative.
Another View: Rich P/S Ratio Puts Pressure On Seadrill
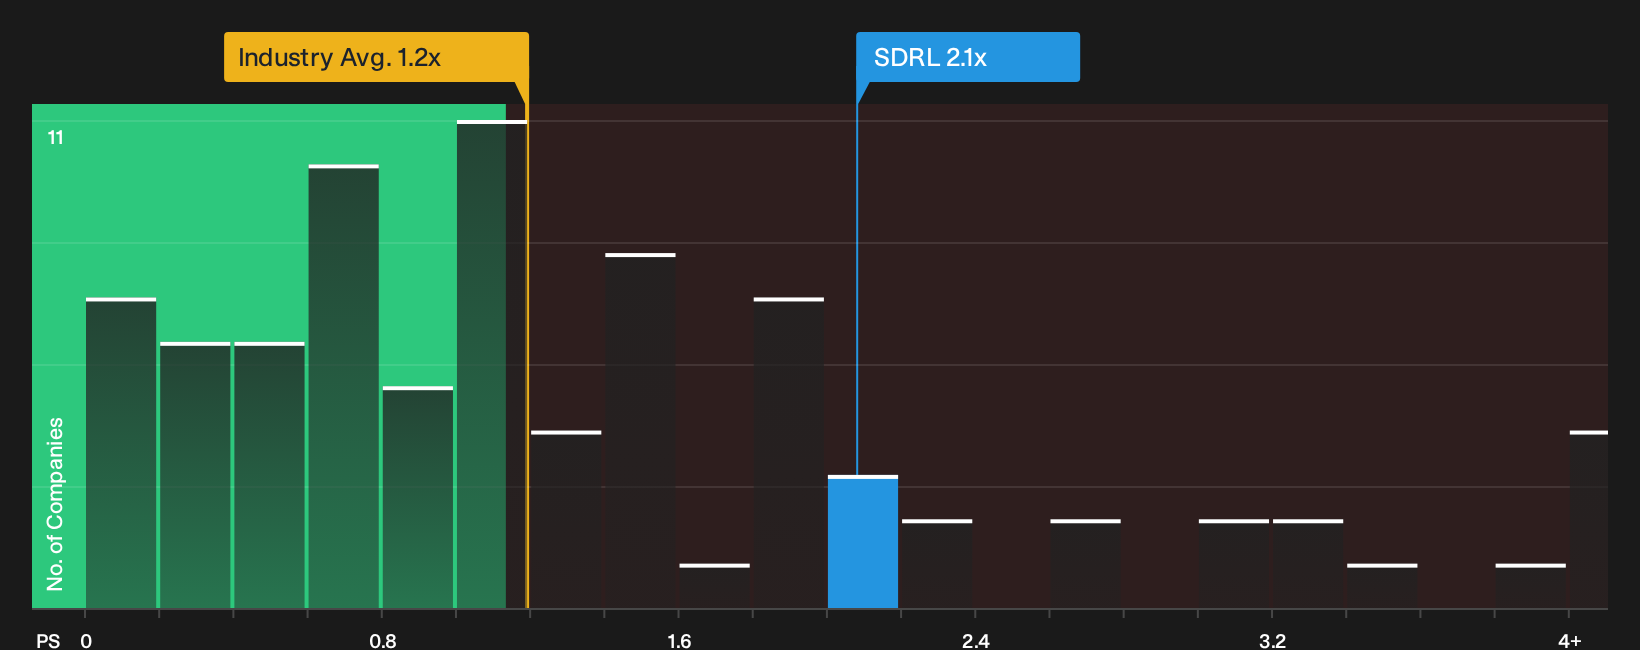
The SWS DCF model flags Seadrill as trading well below an estimated future cash flow value of $83.68 per share, which leans toward an undervalued label. Against that, a P/S of 2.1x versus a 1.2x industry average and a 1.1x fair ratio hints at real de rating risk if growth expectations ease.
That kind of split verdict invites a simple question: Which matters more for you, the long runway implied by cash flows or the possibility that the P/S multiple drifts closer to the fair ratio as sentiment cools, even if operations keep improving?
See what the numbers say about this price — find out in our valuation breakdown.
Next Steps
You have seen both optimism and concern around Seadrill’s setup, so now is the moment to move fast, test the numbers, and reach your own judgement. To frame that view with a clear checklist of what could go right and what might go wrong, start with 2 key rewards and 2 important warning signs
Looking For More Seadrill Sized Ideas?
Do not stop your research with Seadrill. Broaden your watchlist using focused screens that surface different types of opportunities before the crowd catches on.
- Target value with discipline and use the 32 high quality undervalued stocks to hunt for companies that trade at a discount to their underlying fundamentals.
- Prioritize resilience first and run the 32 resilient stocks with low risk scores to narrow in on businesses with steadier risk profiles.
- Spot tomorrow’s potential leaders early by scanning the 20 high quality undiscovered gems before they land on every investor’s radar.
This article by Simply Wall St is general in nature. We provide commentary based on historical data and analyst forecasts only using an unbiased methodology and our articles are not intended to be financial advice. It does not constitute a recommendation to buy or sell any stock, and does not take account of your objectives, or your financial situation. We aim to bring you long-term focused analysis driven by fundamental data. Note that our analysis may not factor in the latest price-sensitive company announcements or qualitative material. Simply Wall St has no position in any stocks mentioned.
Have feedback on this article? Concerned about the content? Get in touch with us directly. Alternatively, email editorial-team@simplywallst.com