


Dividend profile puts Tompkins Financial in focus
Tompkins Financial (TMP) drew fresh attention after an update highlighted its 2.9% dividend yield, five dividend hikes in five years, and a 2026 earnings estimate of US$7.75 per share.
Recent trading tells a mixed story. Tompkins Financial’s share price has eased over the past month, yet still shows strong momentum with a year to date share price return of 32.67% and a 1 year total shareholder return of 49.65%. This performance frames the dividend profile in a much stronger light.
Compare Tompkins Financial’s income profile with a curated list of banks and financials that pair yield with balance sheet strength using our 8 dividend fortresses
After a near 50% total return over the past year and earnings expected at US$7.75 per share in 2026, the easy upside case on Tompkins Financial is less obvious. Does the risk reward still lean toward buyers at this price?
Price-to-earnings of 7.9x: Is it justified?
Valuation on Tompkins Financial hinges on a P/E of 7.9x at the last close of $96.20, which screens as cheaper than many peers but still looks full against one key fair value yardstick.
The P/E ratio compares what investors pay for each dollar of reported earnings. For a regional bank such as Tompkins Financial, that yardstick often reflects expectations around net interest income, credit costs, and how stable those earnings might be through a full cycle.
Today, the stock trades at a P/E of 7.9x. That is below the US market at 18x, below the US Banks industry on 11.5x, and under the 14.9x peer average. At the same time, Simply Wall St’s fair P/E estimate sits at 6.9x. This indicates the market is assigning a richer multiple than that fair ratio level, which the valuation could move toward if sentiment cools or earnings forecasts continue to point to declining revenue and profit over the next three years.
Explore the SWS fair ratio for Tompkins Financial.
Result: Price-to-earnings of 7.9x (OVERVALUED)
Still, falling annual revenue and net income, along with a valuation already above one fair P/E marker, could pressure Tompkins Financial if sentiment cools.
Find out about the key risks to this Tompkins Financial narrative.
Another view on Tompkins Financial’s value
The P/E points one way, yet the SWS DCF model points another. On that cash flow view, Tompkins Financial at $96.20 sits above an estimated future cash flow value of $70, which frames the stock as overvalued on this second test. Which lens do you trust more for a bank like this?
Look into how the SWS DCF model arrives at its fair value.
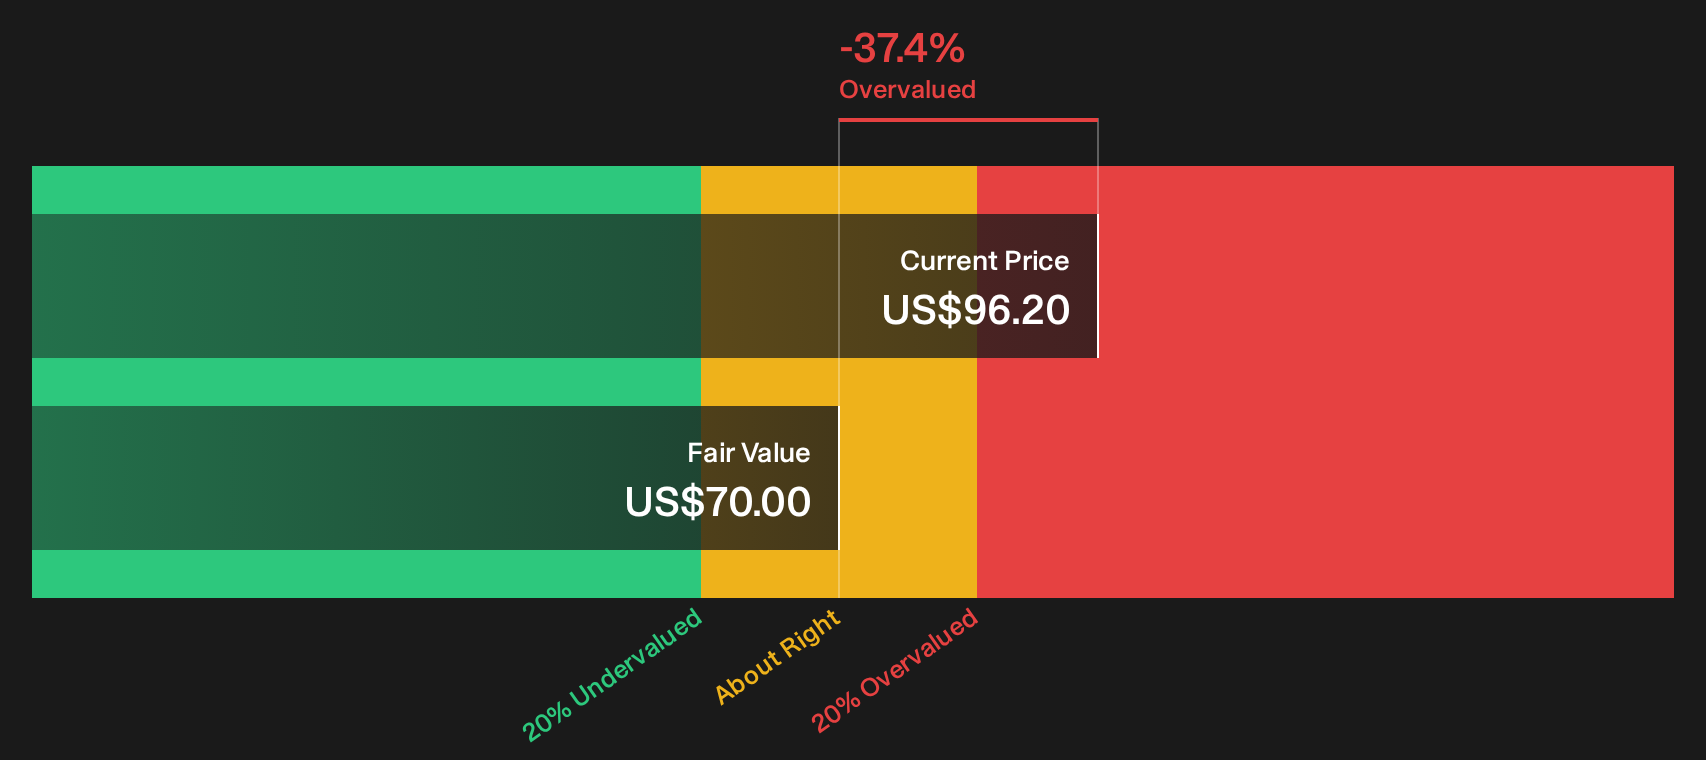
Simply Wall St performs a discounted cash flow (DCF) on every stock in the world every day (check out Tompkins Financial for example). We show the entire calculation in full. You can track the result in your watchlist or portfolio and be alerted when this changes, or use our stock screener to discover 32 high quality undervalued stocks. If you save a screener we even alert you when new companies match - so you never miss a potential opportunity.
Next Steps
Mixed signals on Tompkins Financial can feel confusing, so consider moving quickly, reviewing the underlying data, and pressure testing the story for yourself using 3 key rewards and 1 important warning sign
Looking for more investment ideas beyond Tompkins Financial?
If Tompkins Financial has sharpened your focus on valuation and income, you may want to broaden your watchlist with a few targeted screens that surface different types of opportunities.
- Target resilient balance sheets and steady fundamentals by scanning our list of solid balance sheet and fundamentals (25 results) so you are not relying on a single bank to carry your portfolio.
- Spot attractively priced opportunities by reviewing the 32 high quality undervalued stocks and compare how their valuations stack up against what you just saw with Tompkins Financial.
- Explore additional income ideas by lining Tompkins Financial up against the 8 dividend fortresses and evaluating the yield and quality combinations on offer.
This article by Simply Wall St is general in nature. We provide commentary based on historical data and analyst forecasts only using an unbiased methodology and our articles are not intended to be financial advice. It does not constitute a recommendation to buy or sell any stock, and does not take account of your objectives, or your financial situation. We aim to bring you long-term focused analysis driven by fundamental data. Note that our analysis may not factor in the latest price-sensitive company announcements or qualitative material. Simply Wall St has no position in any stocks mentioned.
Have feedback on this article? Concerned about the content? Get in touch with us directly. Alternatively, email editorial-team@simplywallst.com