


Global Net Lease (GNL) has just reaffirmed its income focus by declaring a US$0.19 per share cash dividend, with an ex dividend date set for October 9 and payment scheduled for October 16, 2026.
Global Net Lease shares closed at US$7.67, with the 30 day share price return down 15.25% and the year to date move lower by 13.04%. However, the 1 year total shareholder return is 8.07% and the 3 year total shareholder return is 26.17%, which points to fading short term momentum against a stronger recent income driven track record.
Compare Global Net Lease to a curated group of income focused real estate plays by scanning our 8 dividend fortresses that combine elevated yields with disciplined fundamentals.
The recent slide in Global Net Lease, alongside its fresh dividend declaration, puts the focus squarely on price. Do current levels still offer a fair trade off between income and risk?
Most Popular Narrative: 23% Undervalued
On the most followed narrative, Global Net Lease screens as undervalued, with a fair value estimate of $10.00 against the latest $7.67 close. This puts the focus on whether the current income stream compensates for balance sheet and portfolio risks.
The deliberate portfolio transformation toward a pure-play single-tenant net lease structure, with a focus on essential industrial, logistics, and high-quality office assets, is intended to align GNL with rising tenant demand for mission-critical real estate and asset-light business models. The aim is to support higher occupancy, more stable revenue streams, and topline revenue growth.
See why 9 investors see Global Net Lease as 23% undervalued.
Result: Fair Value of $10.00 (UNDERVALUED)
Still, heavy office exposure and elevated leverage, with net debt to adjusted EBITDA at 6.6x and gross debt of about US$3.1b, could quickly pressure the Global Net Lease narrative.
Find out about the key risks to this Global Net Lease narrative.
Another View: What Multiples Say About Global Net Lease
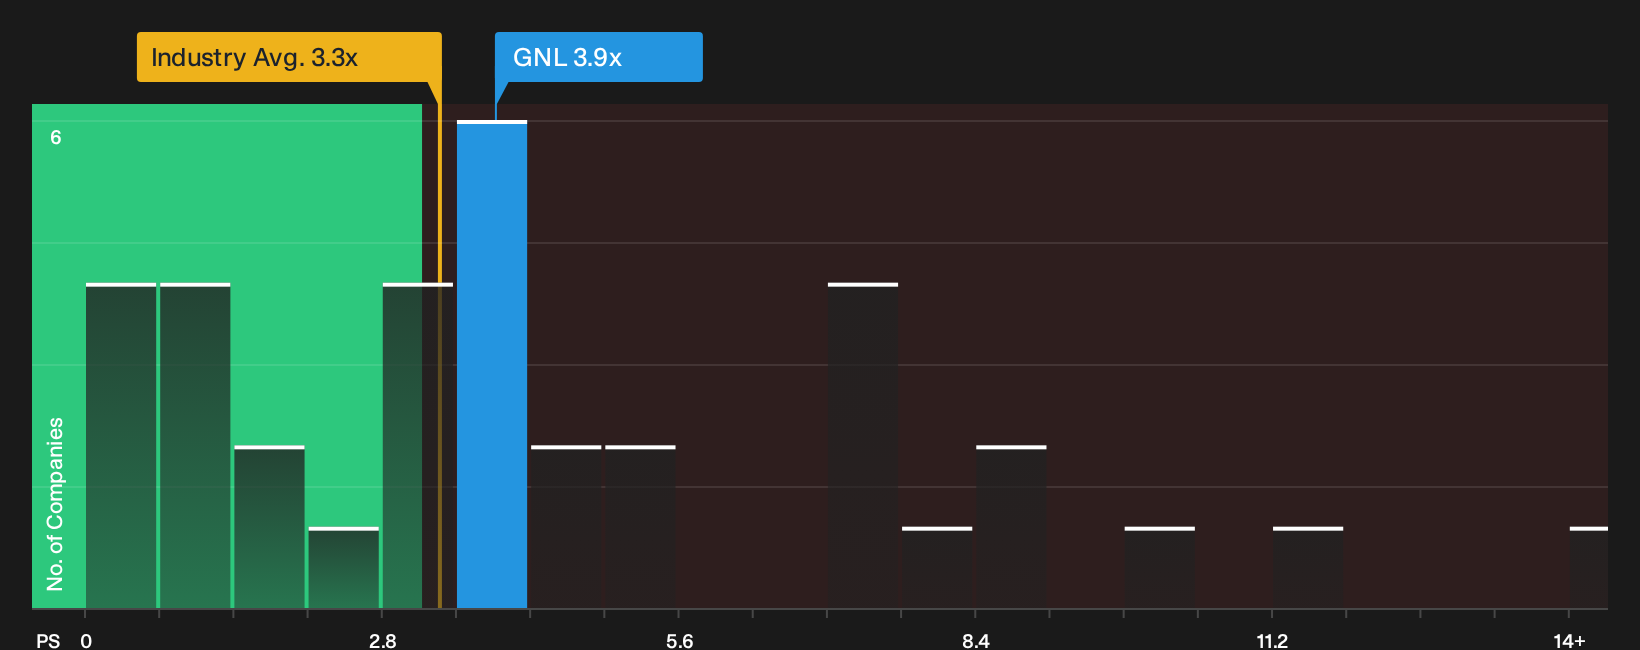
Fair value models paint Global Net Lease as undervalued, yet simple pricing math tells a different story. On P/S, GNL trades at 3.9x, which is richer than the 3.3x North American REITs average, even though it screens cheaper than its 4.8x peer average and a 5.5x fair ratio. That mix hints at both potential upside and real valuation risk. Which side of that trade-off matters more to you?
For a closer look at how that pricing gap could close over time, including what it might mean for income focused investors, See what the numbers say about this price — find out in our valuation breakdown..
Next Steps
Mixed on Global Net Lease so far? Act while the information is fresh and pressure test the income story yourself by weighing 2 key rewards and 3 important warning signs.
Looking for more Global Net Lease style income ideas?
If Global Net Lease has your attention, do not stop here. Use the same energy on other opportunities and let the data do the heavy lifting.
- Target reliable cash generators by running a screen on 8 dividend fortresses that align high yields with disciplined financial profiles.
- Hunt for mispriced opportunities using the 32 high quality undervalued stocks that combine quality fundamentals with what may be discounted market expectations.
- Prioritise sleep-at-night holdings by checking the 32 resilient stocks with low risk scores that emphasise resilient balance sheets and lower volatility profiles.
This article by Simply Wall St is general in nature. We provide commentary based on historical data and analyst forecasts only using an unbiased methodology and our articles are not intended to be financial advice. It does not constitute a recommendation to buy or sell any stock, and does not take account of your objectives, or your financial situation. We aim to bring you long-term focused analysis driven by fundamental data. Note that our analysis may not factor in the latest price-sensitive company announcements or qualitative material. Simply Wall St has no position in any stocks mentioned.
Have feedback on this article? Concerned about the content? Get in touch with us directly. Alternatively, email editorial-team@simplywallst.com