


Buyback completion and full year results sharpen focus on J D Wetherspoon valuation
The fresh catalyst for J D Wetherspoon (LSE:JDW) is a double header. Full year 2026 results landed alongside confirmation that the pub operator has finished a sizeable share repurchase programme.
Sales for the twelve months to 26 July 2026 came in at £2,238.02 million compared with £2,127.52 million a year earlier. Net income over the same period was £60.49 million compared with £67.99 million, with basic earnings per share from continuing operations at £0.595 versus £0.6 and diluted earnings per share at £0.558 versus £0.568.
Alongside the earnings statement, the group reported that from 26 January 2026 to 26 July 2026 it bought back 6,960,981 shares for £46 million, equal to 6.7% of its share count. That brings the total programme, first announced on 25 November 2025, to 9,731,731 shares repurchased for £66.1 million, which represents 9.36% of the equity.
Those announcements arrive after a strong run in the stock over recent months, with the share price up 28.8% over the past month and 38.9% over the past 3 months. On a longer view, J D Wetherspoon shows a 35.7% return year to date, 61.9% over one year, around 60.5% over three years and 9.7% over five years.
That performance, combined with current earnings, feeds into a valuation debate. The shares trade on a P/E ratio that many investors would regard as rich for a traditional pub and hotel operator. This raises questions about how much of the recovery story is already reflected in the price.
With the full year 2026 update and completion of the buyback now public, investors appear to be reassessing J D Wetherspoon's risk and recovery profile. The 30 day share price return of 28.82% and 90 day share price return of 38.94% point to strong short term momentum. The 1 year total shareholder return of 61.91% and 3 year total shareholder return of 60.54% show that the recent rally comes on top of already solid longer term gains.
Spot similar surges and rich valuations by scanning our hand picked list of 8 high quality undervalued stocks, which may offer a different balance between momentum and fundamentals.The sharp move in J D Wetherspoon now leaves the shares trading above both analyst targets and estimated fair value. Is the market overpaying for the recovery story, or simply pricing in fewer risks than the models assume?
Price-to-earnings of 17.1x: Is it justified for J D Wetherspoon?
At the last close of £10.08, J D Wetherspoon is trading on a P/E of 17.1x, which pitches the stock slightly above its own fair P/E estimate and a touch below the wider UK hospitality sector.
The P/E ratio compares what investors are willing to pay today for each pound of current earnings. For a pub and hotel operator like J D Wetherspoon, that multiple reflects what the market thinks about the sustainability of its profits, the resilience of cash flows, and the risks around funding and execution.
Here, the picture is mixed. The P/E of 17.1x is below the UK hospitality industry average of 17.5x. However, it sits above the peer group average of 15.8x and the estimated fair P/E of 14.3x. That combination suggests investors are paying a premium to similar operators and to the fair ratio level that the market could move towards, despite forecast earnings growth of 4.2% per year, lower expected profit growth than the broader UK market, lower net profit margins than last year, interest costs that are not well covered by earnings, a low 18% return on equity, and financial results that include large one off items.
Against that backdrop, the sector comparison is blunt. The P/E might look reasonable versus the wider hospitality group, but it is meaningfully richer than both the 14.3x fair ratio and the 15.8x peer average, which points to the market assigning J D Wetherspoon a full valuation relative to its own fundamentals and nearer competitors.
Explore the SWS fair ratio for J D Wetherspoon.
Result: Price-to-earnings of 17.1x (OVERVALUED).
Still, rich expectations around J D Wetherspoon leave little room for setbacks if earnings underwhelm or if higher financing costs squeeze its already modest net income.
Find out about the key risks to this J D Wetherspoon narrative.
Another view on J D Wetherspoon valuation
The SWS DCF model points in the opposite direction to the earnings multiple. On this view, J D Wetherspoon at £10.08 sits above an estimated future cash flow value of £7.50, which frames the shares as overvalued on cash generation. If earnings wobble, does that gap start to matter?
Look into how the SWS DCF model arrives at its fair value.
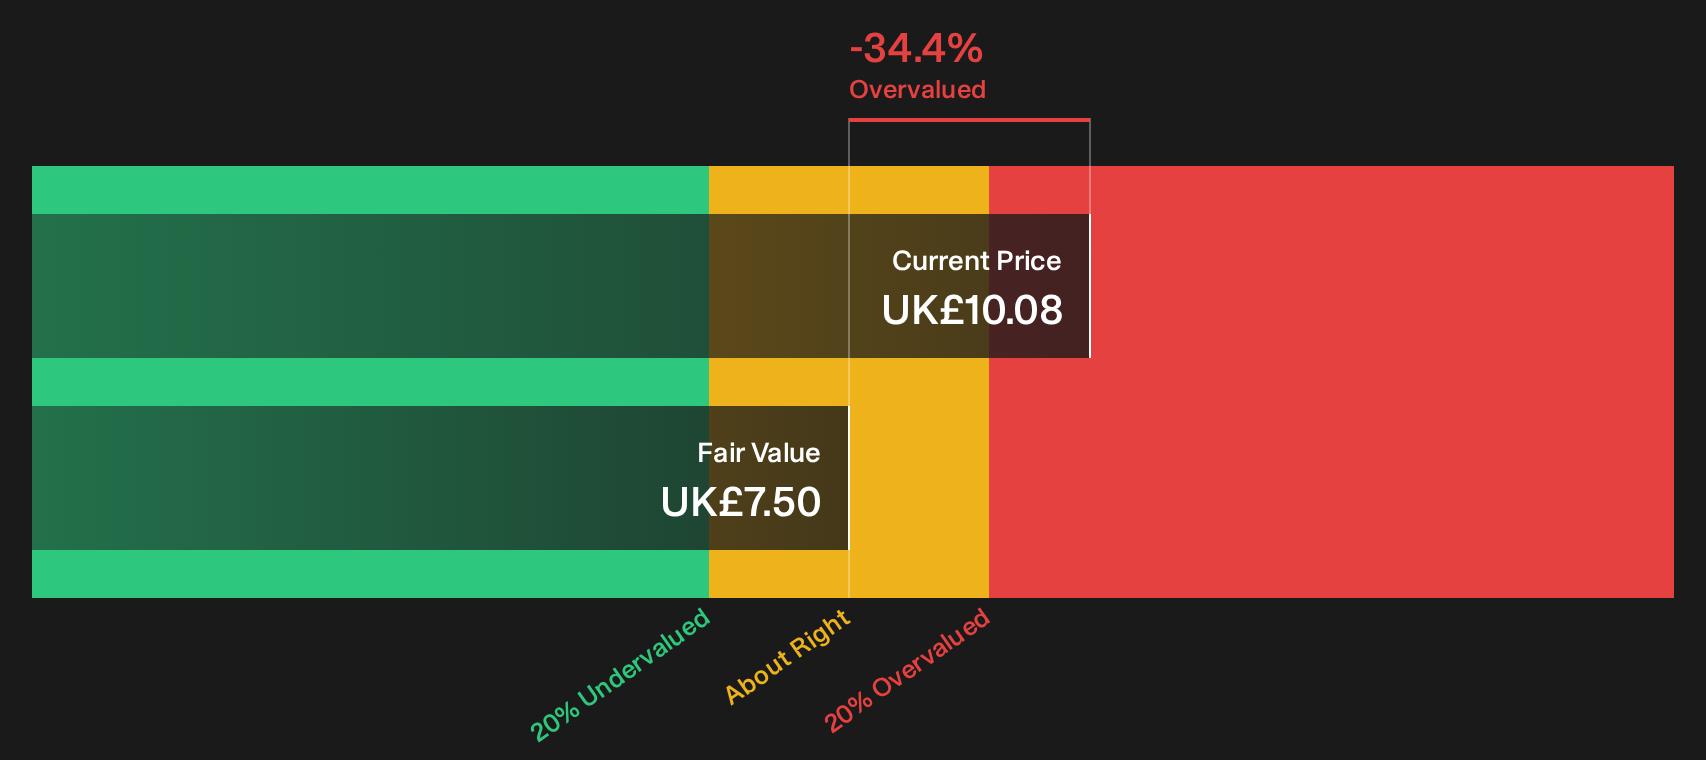
Simply Wall St performs a discounted cash flow (DCF) on every stock in the world every day (check out J D Wetherspoon for example). We show the entire calculation in full. You can track the result in your watchlist or portfolio and be alerted when this changes, or use our stock screener to discover 8 high quality undervalued stocks. If you save a screener we even alert you when new companies match - so you never miss a potential opportunity.
Next Steps
Conflicted by the mix of optimism and concern around J D Wetherspoon right now? Treat this as a prompt to review the numbers yourself, weigh both sides of the story, and then run through the 2 key rewards and 2 important warning signs.
Looking for more J D Wetherspoon style investment ideas?
If the J D Wetherspoon story has sharpened your focus on price, quality, and risk, do not stop here. Use the tools available and widen your opportunity set.
- Hunt for value with momentum by reviewing our hand picked pool of 8 high quality undervalued stocks that combine appealing prices with stronger fundamentals.
- Prioritise resilience and sleep easier by scanning a 4 resilient stocks with low risk scores that filters for sturdier balance sheets and steadier return profiles.
- Get ahead of the crowd by checking a 5 high quality undiscovered gems built around financially solid businesses that have yet to attract broad attention.
This article by Simply Wall St is general in nature. We provide commentary based on historical data and analyst forecasts only using an unbiased methodology and our articles are not intended to be financial advice. It does not constitute a recommendation to buy or sell any stock, and does not take account of your objectives, or your financial situation. We aim to bring you long-term focused analysis driven by fundamental data. Note that our analysis may not factor in the latest price-sensitive company announcements or qualitative material. Simply Wall St has no position in any stocks mentioned.
Have feedback on this article? Concerned about the content? Get in touch with us directly. Alternatively, email editorial-team@simplywallst.com