


St. Joe (JOE) has outlined how Hurricane Isaias affected its Northwest Florida operations, with power restored, most hospitality and commercial sites open again, and cleanup still underway at certain golf and beach facilities.
Investors have been rewarding this resilience, with St. Joe’s 1-year total shareholder return of 38% and 5-year total shareholder return of 58.07% far outpacing its recent 90-day share price return of 7.88%. This suggests that momentum has cooled after a strong multi year run.
Scan how other real estate and asset-heavy stocks are priced after recent storms affecting operations by reviewing our curated list of 32 resilient stocks with low risk scores.
Bulls point to St. Joe’s hurricane resilience and premium P/E, while bears focus on how far that multiple stretches past peers. With the numbers now on the table, which side does the valuation actually lean toward?
Price-to-Earnings of 30.7x: Is it justified?
On a simple headline metric, St. Joe changes hands at a P/E of 30.7x, which is rich compared to both real estate peers and the broader US property sector. That premium sits on top of a $66.36 share price, so any investor using earnings as the yardstick is immediately paying up versus the pack.
The P/E ratio puts the current share price next to per share earnings and asks how many years of those profits buyers are willing to pay for today. For an asset heavy real estate developer and operator like St. Joe, that matters because cash generation and profit quality are central to the story, rather than rapid top line expansion or speculative revenue targets.
Recent fundamentals give some context for why the market might accept a higher multiple. Earnings have grown by 48.7% over the past year compared with a 10.2% per year pace over the last 5 years, and net profit margins of 22.5% sit higher than last year’s 19.4%. Management also records high quality earnings and a return on equity of 16%, which, while described as low against a 20% benchmark, still ties profit growth directly to the equity base.
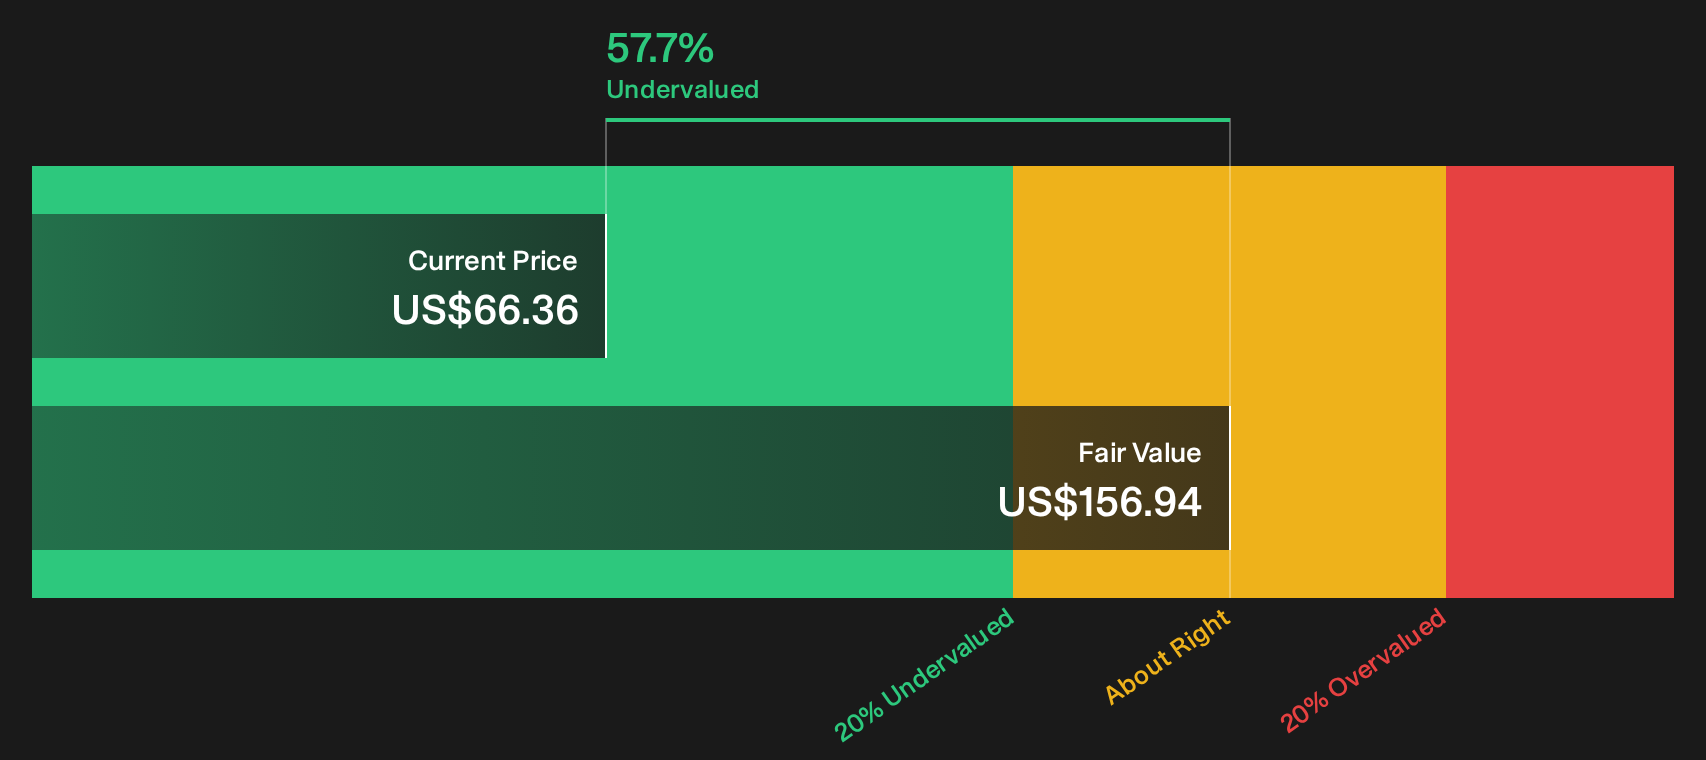
Against that backdrop, the premium is not small. St. Joe trades at 30.7x earnings versus a peer average of 25.9x and a US real estate industry average of 14.4x, which is a steep mark up relative to the sector. While our SWS DCF model suggests the stock trades at a 57.7% discount to an estimated future cash flow value of $156.94, the earnings multiple alone points to a market that is willing to pay well above sector norms for the current profit stream.
See what the numbers say about this price — find out in our valuation breakdown.
Result: Price-to-Earnings of 30.7x (OVERVALUED)
Still, St. Joe’s rich P/E and heavy exposure to Northwest Florida leave the story vulnerable if investor appetite for premium multiples weakens or if future storm impacts intensify.
Find out about the key risks to this St. Joe narrative.
Another View: St. Joe Through A Cash Flow Lens
Where the P/E argument paints St. Joe as expensive, the SWS DCF model tells a different story. At a share price of $66.36 and an estimated future cash flow value of $156.94, the stock screens as trading about 57.7% below that fair value estimate. Which yardstick do you trust more when the signals clash?
Look into how the SWS DCF model arrives at its fair value.
Simply Wall St performs a discounted cash flow (DCF) on every stock in the world every day (check out St. Joe for example). We show the entire calculation in full. You can track the result in your watchlist or portfolio and be alerted when this changes, or use our stock screener to discover 32 high quality undervalued stocks. If you save a screener we even alert you when new companies match - so you never miss a potential opportunity.
Next Steps
Mixed about what the rest of this St. Joe story implies for the next move? Act quickly and review the same data, then weigh both the upside potential and the risk flags highlighted in our 2 key rewards and 1 important warning sign
Looking for more St. Joe style investment ideas?
If St. Joe’s mix of resilience and valuation tension caught your eye, do not stop here. Broaden your watchlist with focused stock ideas using the Simply Wall Street Screener.
- Target value opportunities by scanning companies that combine quality fundamentals with attractive pricing through the 32 high quality undervalued stocks.
- Build a steadier income base by reviewing a curated set of higher yielding payers in the 8 dividend fortresses.
- Strengthen portfolio durability by filtering for businesses with healthier finances using the list of solid balance sheet and fundamentals (25 results).
This article by Simply Wall St is general in nature. We provide commentary based on historical data and analyst forecasts only using an unbiased methodology and our articles are not intended to be financial advice. It does not constitute a recommendation to buy or sell any stock, and does not take account of your objectives, or your financial situation. We aim to bring you long-term focused analysis driven by fundamental data. Note that our analysis may not factor in the latest price-sensitive company announcements or qualitative material. Simply Wall St has no position in any stocks mentioned.
Have feedback on this article? Concerned about the content? Get in touch with us directly. Alternatively, email editorial-team@simplywallst.com