


Thanks to the globally connected economy, it’s practically impossible for chemical companies — especially those vital to agricultural interests — to be unaffected by geopolitical events, as Mosaic (MOS) recently found out. In the trailing month, MOS stock is down more than 23%, making it one of the Barchart Technical Opinion indicator’s Strong Sell names.
Adding to the pressure, Mosaic stock represents one of the worst large-capitalization losers over the past 30 days. Much of the pessimism stems from supply concerns of potash, where there have been U.S. political discussions regarding the purchase of the commodity from Belarus (according to Google Finance). Obviously, with the Ukraine war once again front and center, the headwind is a serious one.
Nevertheless, it’s also a fundamental reality that Mosaic represents a critical component of the U.S. economy. It’s possible, then, that the market may have overplayed its hand when assessing the true risk profile of MOS stock, thus leading to a positive correction.
There’s a technical argument to be made. Throughout much of 2026, the $21 level has often represented long-term support. Because the Mosaic stock price is currently a few cents above $19, there may be a psychological case that the equity will attempt to seek equilibrium at this previously established baseline.
Personally, I find the state-transition argument to be most persuasive. Under this model, we as market participants already acknowledge that MOS stock is currently struggling in an extremely bearish state. This has changed the immediate perception of the ticker — but it’s what typically happens next that is of interest to me.
In other words, the question isn’t whether Mosaic stock is considered bearish right now; of course it is. It’s whether the stock continues to stay bearish — or (as I suspect) transitions to a more optimistic state.
Why the $21 Debit Spread May be in Play for MOS Stock
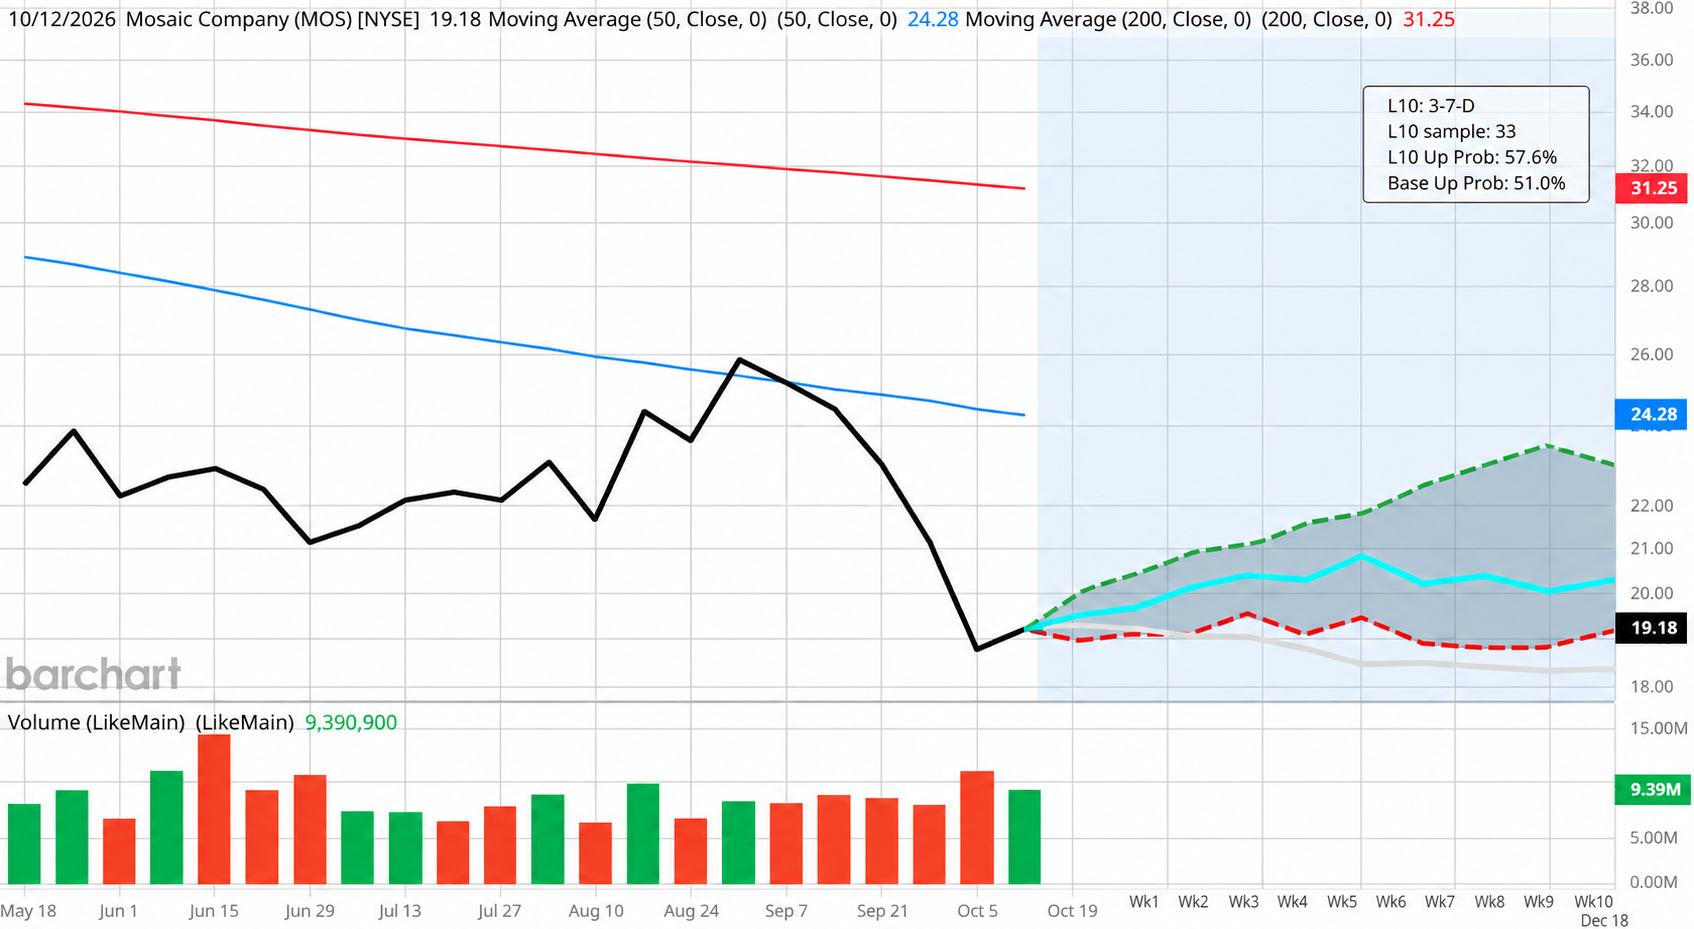
In the last two months, Mosaic stock had printed 10 weekly candlesticks, with only three of these sessions resulting in net positive price action. Because of the drawdown-dominant order flow, it appears that the bears have decisive control of the agricultural specialist.
However, we know from historical data (over the trailing five years) that when this particular quantitative sequence materializes, MOS stock tends to swing higher by a median bump of approximately 6.88% over the next six weeks. If we apply this assumption to the current share price, we would expect the ticker to land at around $40.50, which would be a nickel above the breakeven price of the 20/21 bull call spread expiring Nov. 20.
Further, in terms of the exceedance ratio, we would expect the breakeven probability to land in the neighborhood of around 51.5%. This figure stems from the fact that of the 33 times that the aforementioned quant sequence flashed on a rolling basis, Mosaic stock had exceeded the equivalent of the $40.50 breakeven price on the Nov. 20 expiration date.
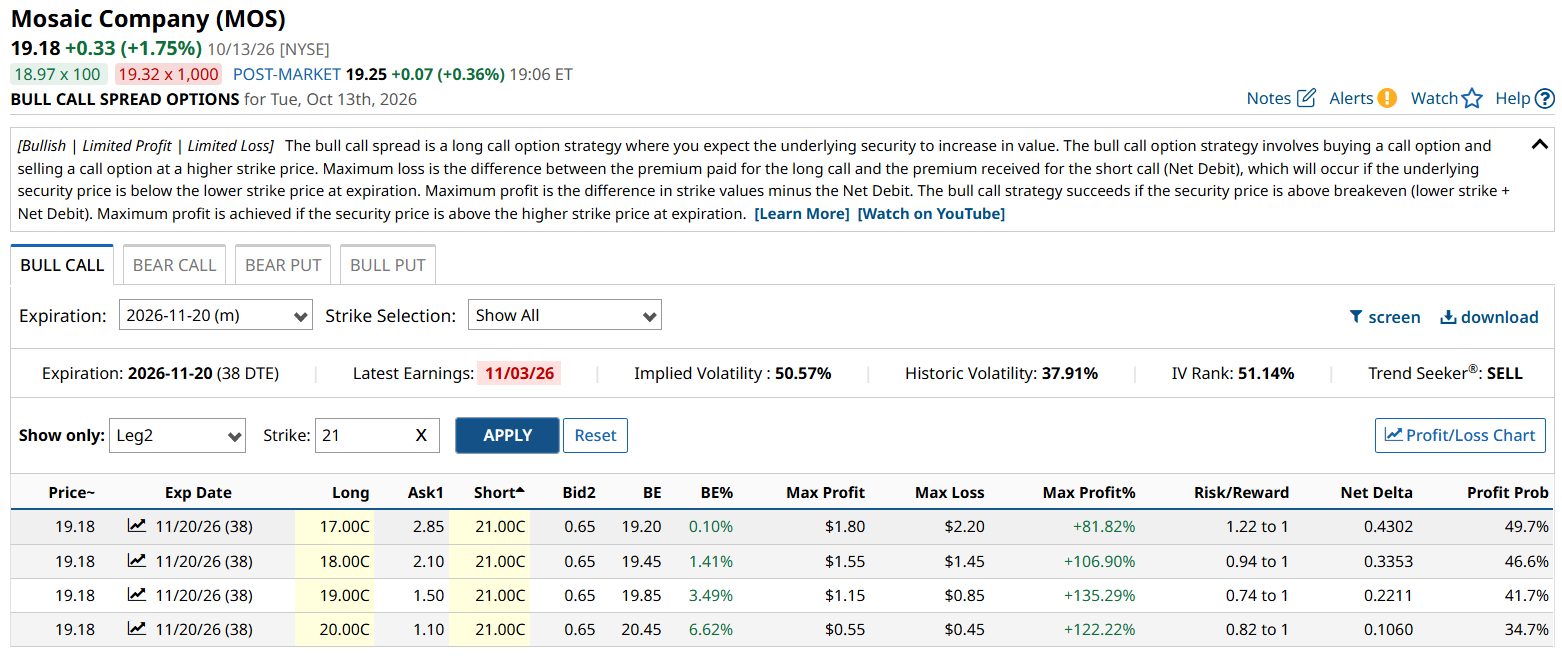
Currently, the implied probability stemming from the time-of-writing MOS stock price has the breakeven probability set at 34.7%. As such, a possibility exists that this options trade could be favorably underpriced when statistical inferences are based on state-to-state transition models rather than an implied-volatility (IV) framework.
There may also be a mispricing opportunity relative to the $21 full-profitability target. An IV-based framework would have the probability of MOS stock triggering the second-leg strike on expiration at 27.96%. However, if we apply a state-to-state logic, the exceedance ratio of MOS at $21 on Nov. 20 would stand at 36.4%.
To be fair, we’re talking about relatively minor improvements. Still, it’s important to point out that the next lowest strike down — the $20 strike — features bull spreads with a maximum payout of only around 67%. From a risk-efficiency standpoint, the improvement in probability (stemming from a lower bar) would merely lead to a miniscule lift.
Also, a fundamental point here is that the probability boost of the original 20/21 bull spread was for “free.”
Using a Shift in Philosophy to Your Advantage
When seeking to boost returns on capital (ROC) with debit spreads, the main levers involved are either the payout or the probability of success. Usually, you can’t do anything about the payout because this figure ultimately stems from the share price, which itself is constantly being negotiated by bulls and bears.
However, the probability of an options trade is somewhat of a different animal. Under Wall Street’s standard mechanism, the probabilities that are calculated also stem from the price. Using the latest IV reading and days to expiration (DTE), these three figures are integrated into a random-walk model to infer the likelihood of the target security hitting a particular price on the selected expiration date.
This approach is a completely reasonable one if indeed the target equity undergoes a random walk between now and expiration. Certainly, many tickers would represent viable candidates for projected randomness in price discovery.
Of course, what makes this case different is that we’re not talking about securities in the abstract; we’re talking about Mosaic stock specifically. Right now, MOS is structured in an extremely bearish state. History has demonstrated that under the same structural analog, the ticker tends to swing higher, particularly over the next six weeks.
To me, this type of contrarian-sentiment-biased response indicates nonrandom behavior. Indeed, the data shows that under acute stress, MOS stock undergoes a state-to-state transition, from bearish to bullish. Historically, this transition has been enough so that, on a good day, the $21 strike would be an aggressive but reasonable target.
Granted, history is not guaranteed to repeat nor even rhyme — that’s the obvious risk. But if you want to bet on a contrarian signal before the rest of the market catches on, be sure to put Mosaic stock on your radar.
On the date of publication, Josh Enomoto did not have (either directly or indirectly) positions in any of the securities mentioned in this article. All information and data in this article is solely for informational purposes. For more information please view the Barchart Disclosure Policy here.