


Progressive stock just gave up 4.2% in a single session, yet the headline result was hardly a collapse story. The insurer printed Q3 basic earnings per share of US$4.38 on revenue of US$23.2b, numbers that keep profitability solidly in focus for a business built on underwriting discipline. Trailing 12 month basic earnings per share of US$19.90 anchor that picture. The real plot twist is not that the quarter fell apart. It is that a cooler print after two very strong quarters collided with a market that had priced in something closer to perfection.
Like the earnings profile at Progressive but unsure whether the recent reaction is giving you the right risk or reward balance? Check out our curated list of insurers and financials with resilient underwriting and strong balance sheets in the list of solid balance sheet and fundamentals stocks (25 results).
Q3 2026 Earnings Summary
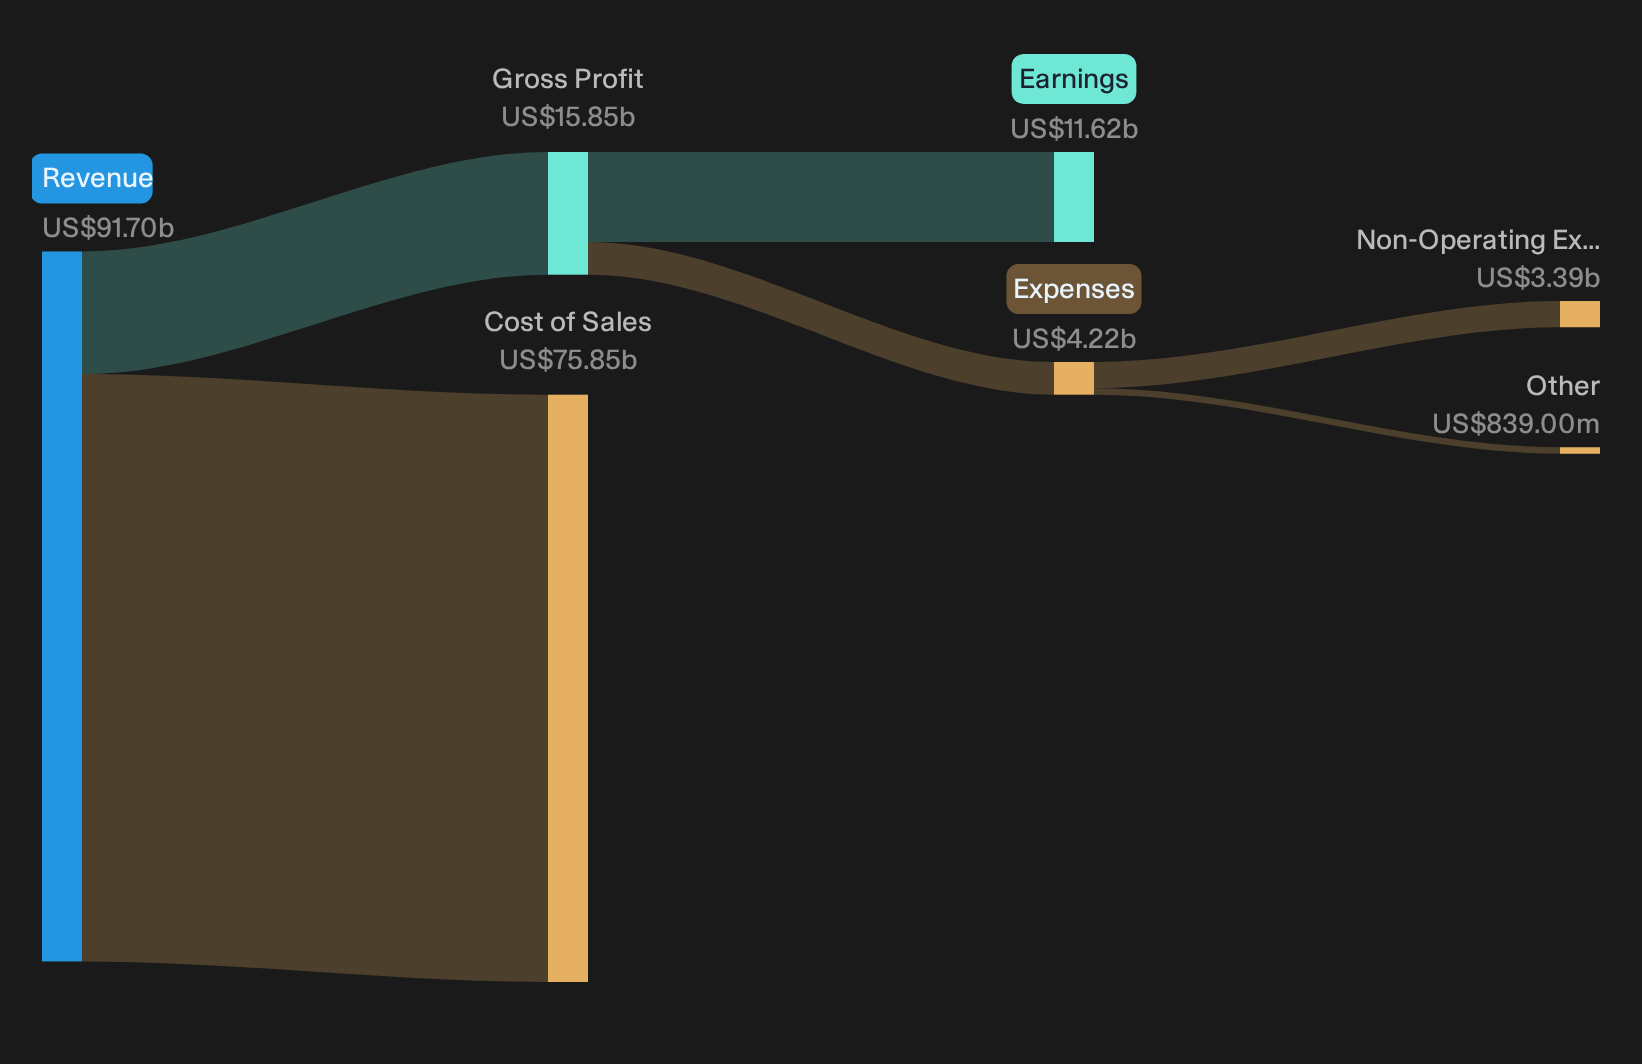
- Total Revenue (Q3 2026 vs. Q3 2025): US$23,182m vs. US$22,502m (up about 3.0%)
- Net Income, excl. extra items (Q3 2026 vs. Q3 2025): US$2,542m vs. US$2,615m (down about 2.8%)
- Basic EPS (Q3 2026 vs. Q3 2025): US$4.38 vs. US$4.46 (down about 1.8%)
- Combined Ratio (Q3 2026 vs. Q3 2025): 87.3% vs. 89.5% (improved by about 2.2 percentage points)
Tired of squinting at earnings tables and raw figures to make sense of Progressive? See the full visual breakdown of Progressive's share price performance in our company report for Progressive.
Progressive’s Bull Story: Underwriting Milestones Get Real
Bulls argue Progressive can turn deep household reach and tech heavy underwriting into durable profitability while it leans into capital leverage. Q3 results offer concrete checkpoints. The combined ratio at 87.3% versus 89.5% a year ago lines up with management’s promise to grow at or below 96%. That is a key proof point for the claim that new pricing models, telematics and AI are sharpening risk selection rather than just chasing volume.
Property is another core test. Management has already taken property combined ratios to 75 in 2025 and about 78 year to date in 2026 while cutting high weather state exposure and lowering modeled 1 in 100 probable maximum loss, or PML. Those milestones support the idea that the “multi year property turnaround” is substantially complete and that the Robinsons bundling push is being built on a more predictable underwriting base.
Reveal where the surface looks calm while the models start to diverge, and see where the street is quietly placing the next big inflection in Progressive’s timeline with the analyst estimates for Progressive.Progressive Bears Focus On Slower Momentum, Not Collapse
Progressive skeptics argue that softer auto pricing, heavier media spend and slower conversion into bundles would eat into underwriting gains. Q3 results only partially challenge that view. The combined ratio improved to 87.3%, which runs against fears of an immediate margin squeeze, and property profitability metrics still look firm. The problem is growth momentum. Revenue rose about 3% year on year versus much faster expansion a year earlier, and net income excluding extra items slipped about 3%. That moderation, paired with price cuts and higher advertising, fits the concern that it is getting harder to translate auto scale into richer Robinsons households without giving up some earnings power.
The 4.2% one day fall in Progressive’s share price after the release suggests investors were already braced for strong execution and saw this slower print as a miss versus those expectations rather than a sign of a broken business.
After a 4.2% one day share price drop, it is fair to ask whether slower growth is just noise or an early signal of something more structural. Review the full risk analysis for Progressive which shows 3 important warning signsStay Ahead Of Your Next Move
After a 4.2% one day move on mixed Q3 momentum, Progressive is the kind of stock you may want to track closely rather than rush into or walk away from. Register for free with Simply Wall St and add Progressive to your Watchlist so you can watch price against fair value and choose your own time to act. When you are invested, keep the noise out and the key alerts in by managing your holdings through the Portfolio Command Center. Round it out by tapping into thousands of perspectives in the Community so you can identify potential catalysts or emerging risks early and stay a step ahead of the market.
Seeking Fresh Alternatives Beyond Progressive?
Market attention moves fast and fresh breakout ideas do not stay under the radar for long. Scan these curated lists before the momentum gets fully caught and act now.
- Spot potential early movers with tight downside control by reviewing a curated group of resilient stocks in the 32 resilient stocks with low risk scores.
- Position for structural shifts in clean energy and electrification by studying the infrastructure players powering tomorrow’s grids through the 43 power grid technology and infrastructure stocks.
- Ride the AI build out without chasing the headline chips by filtering companies supplying the critical backbone using the 92 AI infrastructure stocks.
This article by Simply Wall St is general in nature. We provide commentary based on historical data and analyst forecasts only using an unbiased methodology and our articles are not intended to be financial advice. It does not constitute a recommendation to buy or sell any stock, and does not take account of your objectives, or your financial situation. We aim to bring you long-term focused analysis driven by fundamental data. Note that our analysis may not factor in the latest price-sensitive company announcements or qualitative material. Simply Wall St has no position in any stocks mentioned.
Have feedback on this article? Concerned about the content? Get in touch with us directly. Alternatively, email editorial-team@simplywallst.com