


Leadership change puts Migdal Insurance and Financial Holdings in the spotlight
Migdal Insurance and Financial Holdings (TASE:MGDL) drew fresh attention after appointing controlling shareholder Shlomo Eliahu as Acting CEO on 8 October 2026, concentrating ownership and day to day management in a single figure.
The leadership shakeup comes after a strong run, with Migdal Insurance and Financial Holdings delivering a 20.26% year to date share price return and a 75.43% total shareholder return over twelve months. However, the 30 day share price return declined 6.07%, hinting that momentum has cooled recently after a very large 3 year total shareholder return above 3x.
Scan how other insurers with solid balance sheets are reacting to leadership and governance shifts by reviewing our curated list of solid balance sheet and fundamentals (203 results) together with Migdal Insurance and Financial Holdings.
For Migdal Insurance and Financial Holdings, the appointment of its controlling shareholder as Acting CEO can signal confidence in the engine of the business or simply mark a swing in sentiment. Which story does the current valuation tell?
Preferred P/E of 10.8x for Migdal Insurance and Financial Holdings: Is it justified?
On the numbers alone, Migdal Insurance and Financial Holdings trades on a P/E of 10.8x, a level that sits slightly below both its direct peer group on 11.9x and the broader Asian insurance sector on 11x, while the last close sits at ₪19.35.
P/E is a simple ratio that compares the current share price with the most recent earnings per share. For an insurance group like Migdal Insurance and Financial Holdings, it acts as a shorthand for how much investors are prepared to pay for each unit of profit in a business that earns returns on capital and manages long term liabilities.
Earnings grew 39.5% over the past year, net profit margins improved from 12.1% to 14.9%, and earnings quality is assessed as high. In that context, a P/E of 10.8x indicates that the market is paying a modest price for current profitability. This is despite a return on equity of 17.5%, which is flagged as low relative to a 20% benchmark, and the absence of a forward forecast to clarify whether this recent acceleration in profit growth is expected to continue.
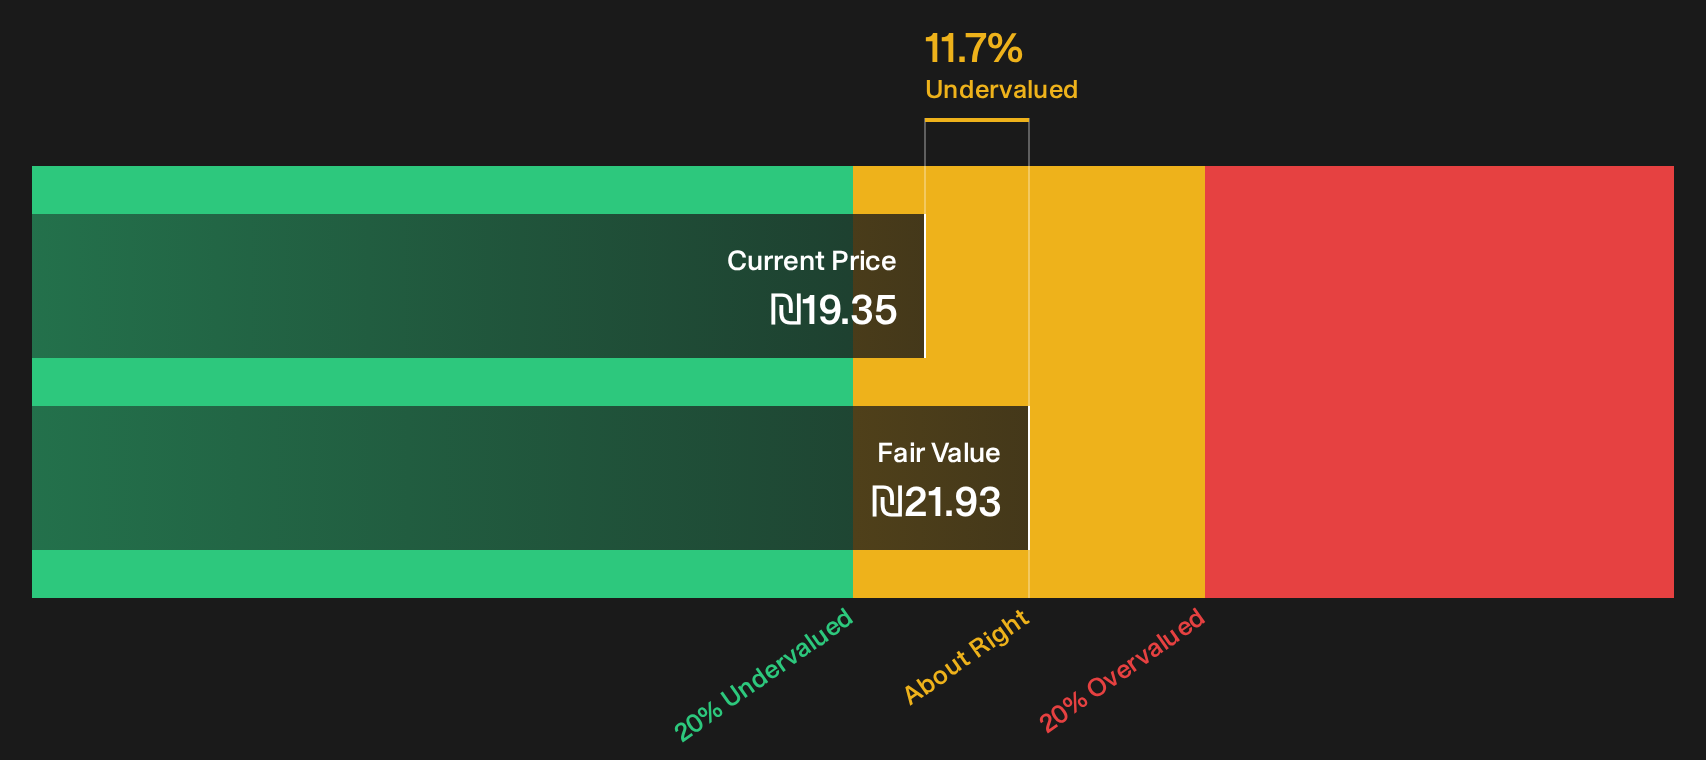
The comparison to peers is tight. Migdal Insurance and Financial Holdings trades slightly below the 11.9x average for similar insurers and marginally under the Asian insurance sector on 11x. This points to a small valuation discount rather than a premium, while our DCF work separately suggests the shares trade about 11.7% below an estimated cash flow value of ₪21.93.
Result: Price-to-Earnings of 10.8x (UNDERVALUED)
See what the numbers say about this price — find out in our valuation breakdown.
Still, the leadership concentration at Migdal Insurance and Financial Holdings, along with the recent 6.07% one-month share price decline, could quickly challenge any underpricing story.
Find out about the key risks to this Migdal Insurance and Financial Holdings narrative.
Another view on Migdal Insurance and Financial Holdings valuation
The P/E lens shows Migdal Insurance and Financial Holdings on a modest multiple, and the SWS DCF model tells a similar story using cash flows. At ₪19.35, the share price sits about 11.7% below an estimated value of ₪21.93. This raises a different question for you: Is the discount compensation for governance concerns or a gap in market attention?
Look into how the SWS DCF model arrives at its fair value.
Simply Wall St performs a discounted cash flow (DCF) on every stock in the world every day (check out Migdal Insurance and Financial Holdings for example). We show the entire calculation in full. You can track the result in your watchlist or portfolio and be alerted when this changes, or use our stock screener to discover 188 high quality undervalued stocks. If you save a screener we even alert you when new companies match - so you never miss a potential opportunity.
Next Steps
Sentiment around Migdal Insurance and Financial Holdings is split, so treat this as a prompt to move quickly on your own homework and stress test the numbers. To see how others are weighing up the upside case, take a closer look at the 2 key rewards.
Looking for more investment ideas beyond Migdal Insurance and Financial Holdings?
If Migdal Insurance and Financial Holdings has sharpened your focus, do not stop here. Use the screener to spot fresh opportunities that fit your style.
- Target potential value opportunities by scanning our 188 high quality undervalued stocks that combine solid fundamentals with a price that still leaves room for your thesis.
- Strengthen your income watchlist by reviewing a focused set of 216 dividend fortresses that aim to keep yields above inflation while maintaining balance sheet discipline.
- Stack the odds toward resilience by tracking 223 resilient stocks with low risk scores that score well on stability so short term noise has less chance to derail your plan.
This article by Simply Wall St is general in nature. We provide commentary based on historical data and analyst forecasts only using an unbiased methodology and our articles are not intended to be financial advice. It does not constitute a recommendation to buy or sell any stock, and does not take account of your objectives, or your financial situation. We aim to bring you long-term focused analysis driven by fundamental data. Note that our analysis may not factor in the latest price-sensitive company announcements or qualitative material. Simply Wall St has no position in any stocks mentioned.
Have feedback on this article? Concerned about the content? Get in touch with us directly. Alternatively, email editorial-team@simplywallst.com