The Zhitong Finance App learned that the China Index Research Institute published an article stating that in September 2026, the second-hand housing market in key cities remained active and continued to grow year-on-year. The month-on-month decline in second-hand housing prices in the top ten cities increased compared to the previous month, and housing prices in Shanghai changed from falling to rising month-on-month. A number of measures to stabilize the real estate market were introduced at the policy level in September, but currently the scale of second-hand housing listings is still relatively high, the supply and demand relationship in the market has not fundamentally improved, and the transmission of transaction recovery to price stabilization will still take time. It is expected that the short-term second-hand housing market will continue to bottom out, prices are still under pressure to adjust, and the differentiation between cities and urban internal sectors will continue.
The month-on-month decline in second-hand housing prices in the top ten cities increased in September, but the decline was less than that of the 100 cities as a whole. Housing prices in Shanghai changed from falling to rising month-on-month
Figure: Average price of second-hand housing listings in the top ten cities in September 2026 and the month-on-month ratio
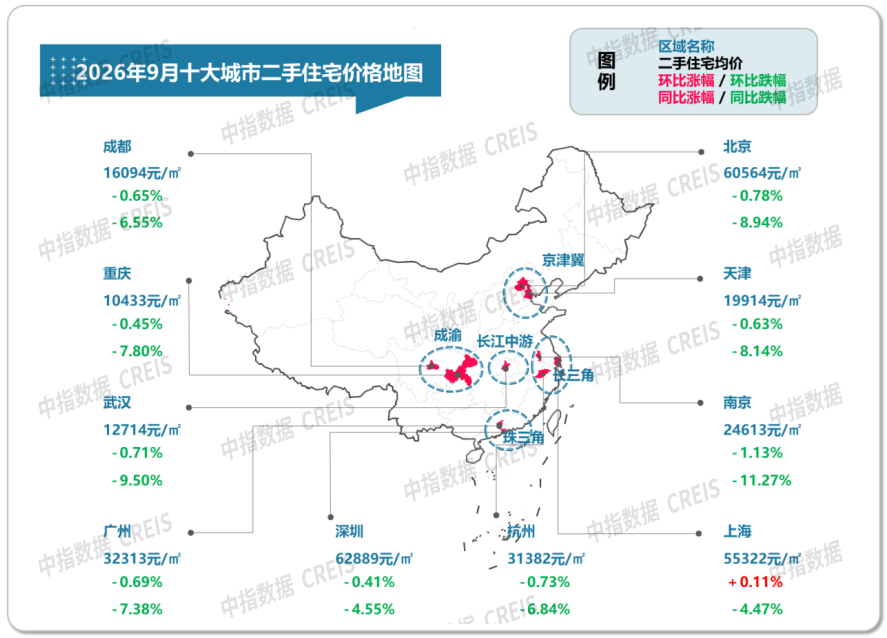
Figure: Average prices and month-on-month changes of second-hand housing in the top ten cities from January 2021 to September 2026
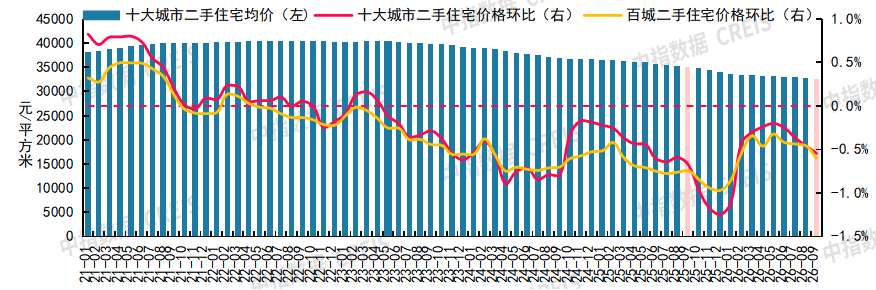
According to the Baicheng Price Index of the China Real Estate Index system, in September 2026, the average price of second-hand housing in Baicheng fell 0.60% month-on-month and 6.94% year on year; the average price of second-hand housing in the top ten cities fell 0.54% month-on-month, down 7.02% year on year.
Beijing: The number of second-hand residential units sold in September fell 0.5% year on year, and the year-on-month price declines all increased
Figure: Month-on-month trend in the number and price of second-hand residential units sold in Beijing from January 2021 to September 2026
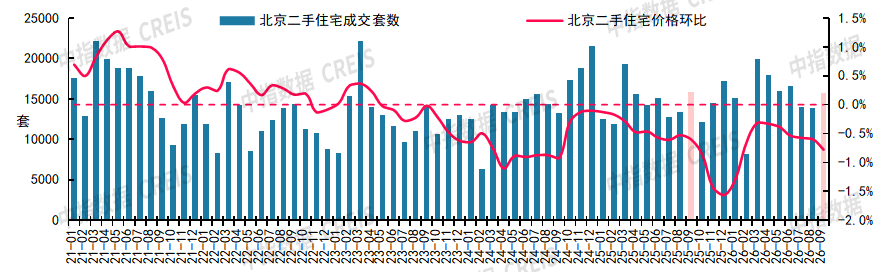
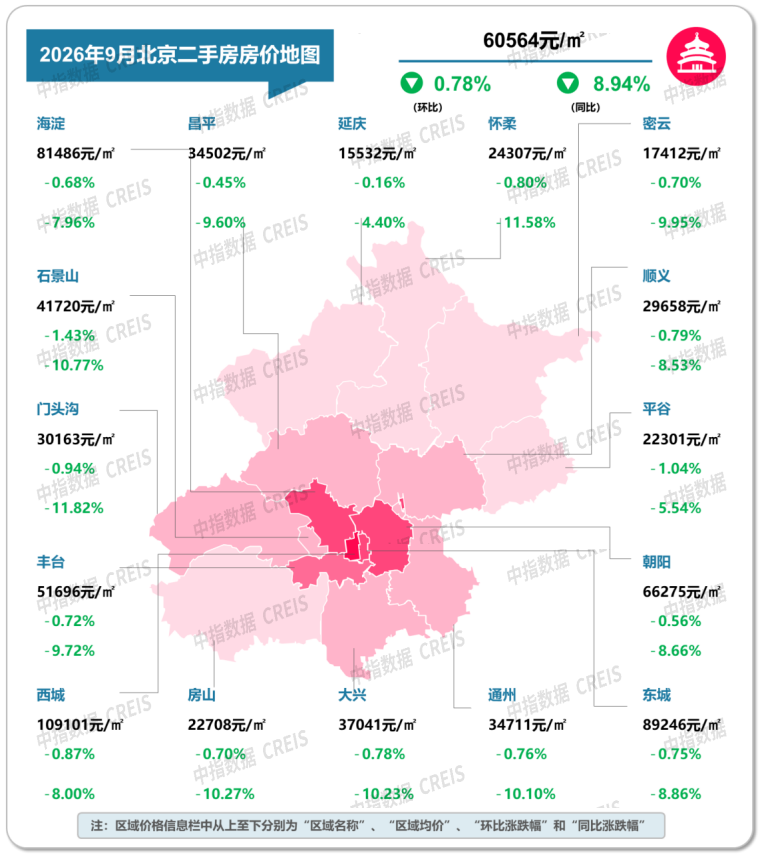
In terms of transactions, in September 2026, 15,756 second-hand residential units were sold in Beijing, a year-on-year decrease of 0.5%. In January-September, a total of 137,000 second-hand housing units were sold, an increase of 5.1% over the previous year. In terms of prices, in September, second-hand housing prices in Beijing fell 0.78% month-on-month. The month-on-month decline was 0.19 percentage points higher than the previous month, down 8.94% year-on-year, and 0.16 percentage points higher than the previous month.
Figure: Average price of second-hand residential listings in Beijing in September 2026 and the month-on-month ratio
Shanghai: Second-hand commercial housing sales increased year-on-year for seven consecutive months, with prices rising 0.11% month-on-month in September
Figure: Month-on-month trend in the number and price of second-hand commercial housing units sold in Shanghai from January 2021 to September 2026
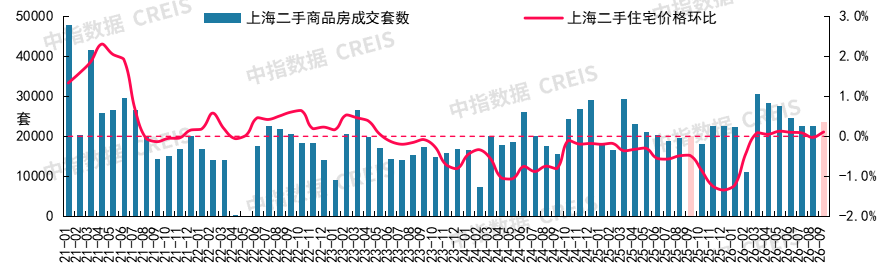
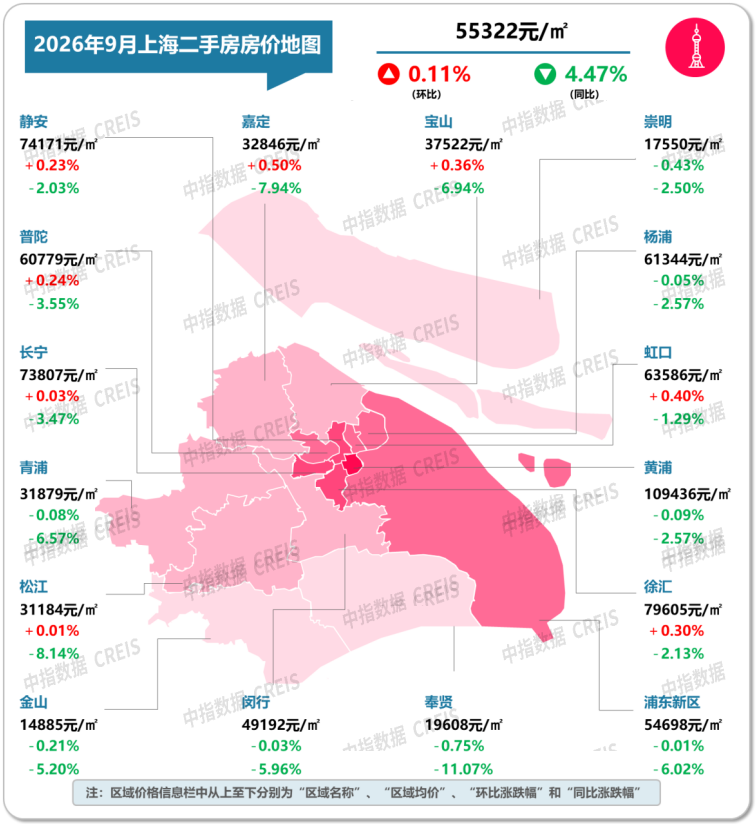
In terms of transactions, in September 2026, 23,581 second-hand commercial housing units were sold in Shanghai, an increase of 17.2% over the previous year. In January-September, a total of 214,000 second-hand commercial housing units were sold, an increase of 14.3% over the previous year. In terms of prices, in September 2026, the average price of second-hand residential listings in Shanghai rose 0.11% month-on-month and fell 4.47% year-on-year. The year-on-year decline was 0.56 percentage points narrower than the previous month.
Figure: Average price of second-hand residential listings in Shanghai's municipal districts in September 2026 and the month-on-month ratio
Guangzhou: The month-on-month decline in second-hand housing prices widened in September, and the year-on-year decline narrowed
Figure: The month-on-month trend of second-hand housing prices in Guangzhou from January 2021 to September 2026
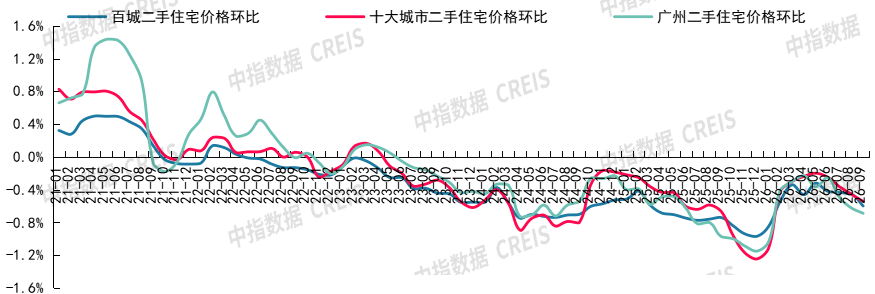
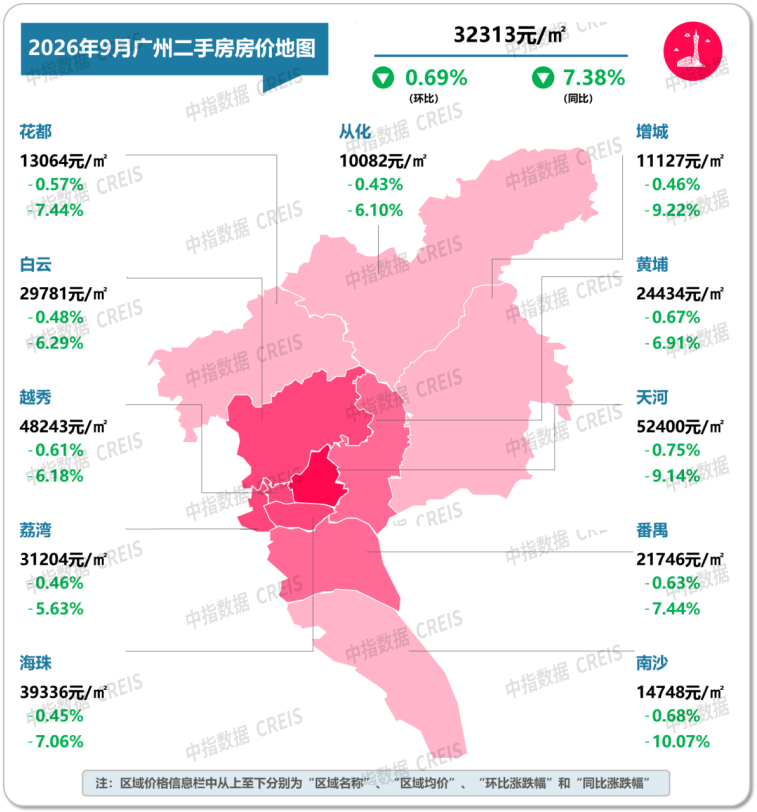
In terms of prices, in September 2026, second-hand housing prices in Guangzhou fell 0.69% month-on-month. The month-on-month decline was 0.07 percentage points higher than the previous month, down 7.38% year-on-year, and the year-on-year decline was 0.26 percentage points narrower than the previous month.
Figure: Average price of second-hand residential listings in Guangzhou's municipal districts in September 2026 and month-on-month
Shenzhen: In September, 4,455 second-hand housing units were sold, down 2.0% year on year, and the month-on-month price decline increased
Figure: Month-on-month trend in the number and price of second-hand residential units sold in Shenzhen from January 2021 to September 2026
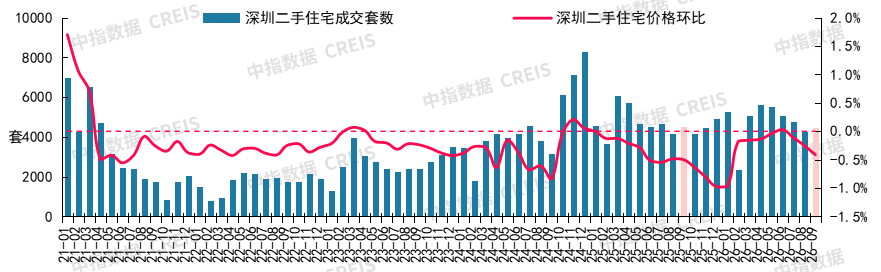
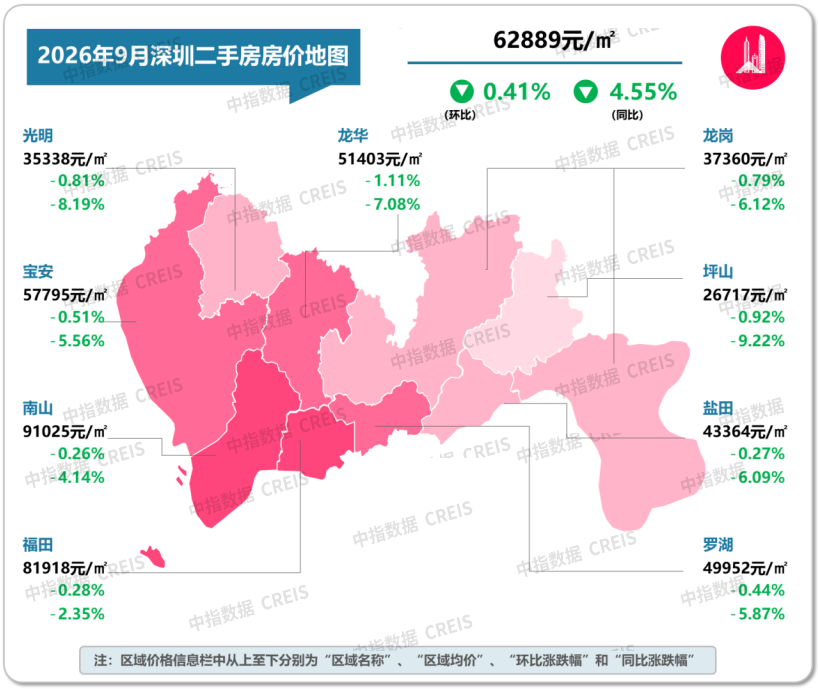
In terms of transactions, in September 2026, 4,455 second-hand residential units were sold in Shenzhen, a year-on-year decrease of 2.0%. A total of 42,000 units were sold in January-September, a year-on-year decrease of 0.3%. In terms of prices, in September, second-hand housing prices in Shenzhen fell 0.41% month-on-month. The month-on-month decline was 0.16 percentage points higher than the previous month, down 4.55% year-on-year, and the year-on-year decline was 0.08 percentage points narrower than the previous month.
Figure: Average price of second-hand residential listings in various municipal districts in Shenzhen in September 2026 and the month-on-month ratio
Hangzhou: In September, 5077 second-hand housing units were sold, up 5.4% year on year, and prices fell 0.73% month on month
Figure: Month-on-month trend in the number and price of second-hand residential units sold in Hangzhou from January 2021 to September 2026
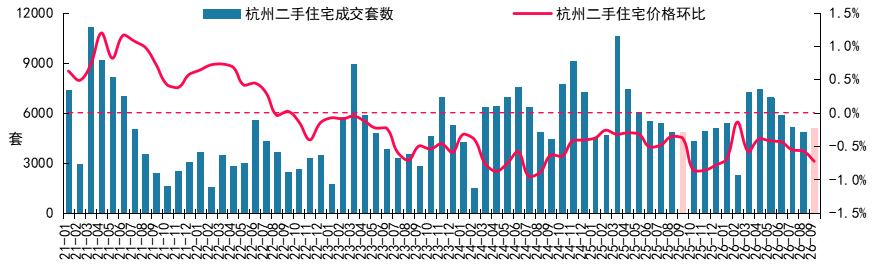
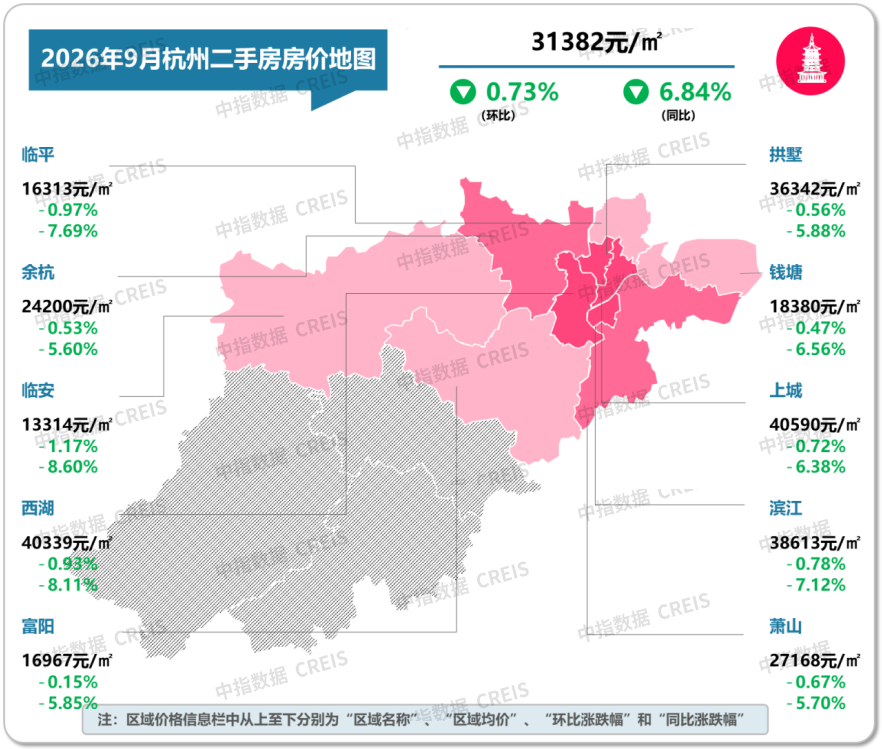
In terms of transactions, in September 2026, 5077 second-hand residential units were sold in Hangzhou, an increase of 5.4% over the previous year. In January-September, a total of 50,000 second-hand housing units were sold, a year-on-year decrease of 6.8%. In terms of prices, in September, second-hand housing prices fell 0.73% month-on-month. The month-on-month decline was 0.15 percentage points higher than the previous month, the year-on-year decline was 6.84%, and the year-on-year decline was 0.33 percentage points higher than the previous month.
Figure: Average price of second-hand residential listings in various municipal districts of Hangzhou in September 2026 and the month-on-month ratio