


Shochiku stock comes into this earnings report already on a quiet winning streak, up over 6% in the past week and modestly higher over one and three months. The headline this quarter is not the share price; it is the profit repair job. After a loss in Q1, management swung back to a net income of ¥1,017m and basic earnings per share of ¥73.98 in Q2, even as quarterly revenue held near ¥24,783m. For investors, the real story now is how that profit rebound lines up with a rich 83.6x P/E and a stretched valuation model.
Like the profit rebound at Shochiku but worried about paying an 83.6x P/E for that recovery story? Compare this earnings report with a curated set of stocks that have more grounded valuations and sturdier fundamentals in our 16 high quality undervalued stocks.
Q2 2027 Earnings Summary
- Revenue (Q2 2027): ¥24,783m vs. ¥27,972m in Q2 2026 (decline in quarterly revenue)
- Net Income (Excl. Extra Items, Q2 2027): ¥1,017m vs. ¥2,613m in Q2 2026 (lower quarterly profit year over year)
- Basic EPS (Q2 2027): ¥73.98 vs. ¥190.10 in Q2 2026 (decline in earnings per share)
- Trailing Net Profit Margin (last 12 months): 1.9% vs. 4.4% in the prior year (compression in profitability)
Prefer clear charts instead of another wall of earnings tables and footnotes? Get a full visual look at Shochiku's valuation story in the company report for Shochiku.
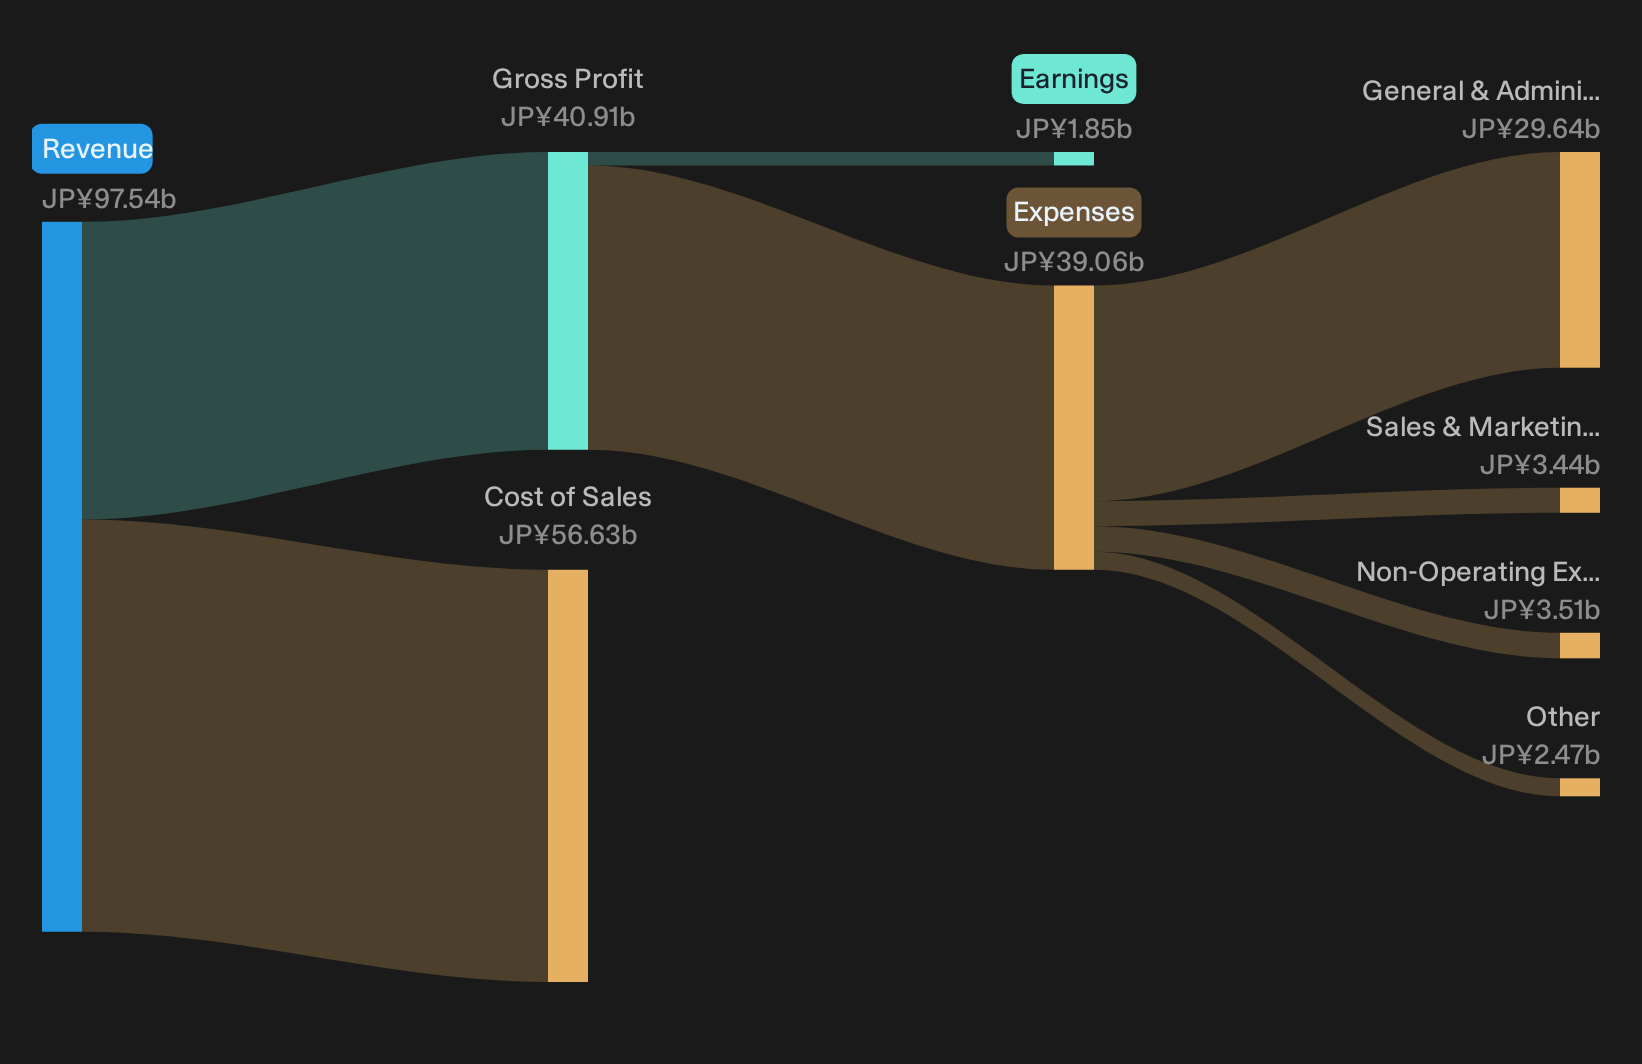
Shochiku earnings: profit repair supports cautious optimism
Shochiku’s latest quarter gives bulls something concrete. After a Q1 loss, the swing to ¥1,017m in net income and basic EPS of ¥73.98 shows the business can still generate profits even with Q2 revenue at ¥24,783m. The trailing net profit margin of 1.9% is below last year’s 4.4%. However, the return to the black plus positive 7 day, 30 day, and 90 day share returns suggests investors are willing to give this profit rebuild some credit.
Weaker margins and slower sales keep caution in play
The bearish narrative around Shochiku’s traditional media exposure still finds support in these numbers. Q2 revenue of ¥24,783m sits below the prior year’s ¥27,972m, and net income excluding extra items of ¥1,017m is well under ¥2,613m. That drop in earnings lines up with a trailing net margin that has compressed to 1.9% from 4.4%. Profits have returned, but thinner economics underline the risk that heritage content and theater remain pressured if top line momentum does not improve.
After a profit rebound built on thinner margins and a high P/E, the bigger question is what investors cannot see yet. Scan our full risk analysis for Shochiku which shows 3 important warning signsStay Ahead With Simply Wall St
Shochiku’s profit rebound alongside a rich P/E and thinner margins makes timing your entry and exit especially important, so register for free with Simply Wall St and add it to your Watchlist to track price against fair value and watch how the story develops. When you decide to take a position, put your holdings inside the Portfolio Command Center so you cut out noise and focus on the updates that actually matter to your thesis. For longer term conviction, compare your view with thousands of other investors through the Community and see how sentiment and expectations shift around new results. That way you spot hidden catalysts and emerging risks early and give yourself a better chance of staying ahead of the market.
Seeking Alternatives Before The Crowd?
Fresh ideas tend to move first, not last. Some stocks can build quiet momentum while attention stays elsewhere, and that window can close quickly. Review these curated shortlists and decide whether they fit your strategy.
- Identify potential yield opportunities before more income-focused investors notice them by reviewing our curated list of 31 dividend fortresses that have already passed strict balance sheet filters.
- Explore the AI theme while it may still be less widely followed by checking hand picked 39 profitable AI stocks that aren't just burning cash that are already generating cash flow instead of focusing on unproven concepts.
- Look for financial resilience as markets continue to shift by focusing on a refined list of solid balance sheet and fundamentals stocks (21 results) so you can concentrate on sturdier balance sheets and clearer fundamentals.
This article by Simply Wall St is general in nature. We provide commentary based on historical data and analyst forecasts only using an unbiased methodology and our articles are not intended to be financial advice. It does not constitute a recommendation to buy or sell any stock, and does not take account of your objectives, or your financial situation. We aim to bring you long-term focused analysis driven by fundamental data. Note that our analysis may not factor in the latest price-sensitive company announcements or qualitative material. Simply Wall St has no position in any stocks mentioned.
Have feedback on this article? Concerned about the content? Get in touch with us directly. Alternatively, email editorial-team@simplywallst.com