


The Zhitong Finance App learned that Citigroup Research released the global stock strategy report “Addressing Profit Risk: Deceleration and Concentration” on October 15, signed by three strategists David Groman, Beata M Manthey, and Nikhil N Jadhav. The report's judgment is that global profits will continue to expand strongly in 2027, but the market will have to overcome two hurdles at the same time — profit growth is about 20 percentage points lower than this year, and the technology sector will contribute an unprecedented share of profit growth. Despite rising risks, Citi maintains the judgment of a “profit-driven upward trend in global stock markets,” and only suggests favoring quality and some defensive assets in terms of allocation over the next few months.
What needs to be clarified is that this is a comparative study of profit structure and history. It is not a point prediction report, nor does it include any individual stock ratings or target prices. Citi's point target comes from its quarterly strategy report “Resilience or Complacency?” released on October 4 : MSCI ACWI target 1440 points by the end of 2026, S&P target of 8100 points by the end of 500.
The two numbers are placed together: a high base of +35%, with a drop of about 20 percentage points
Global earnings per share (EPS) are expected to grow by +35% this year. AI infrastructure construction is the core engine, driving significant profit expansion in the technology sector, emerging markets, and the US stock market. Citi specifically pointed out that this year's profit intensity was rare — with the exception of real estate, EPS was growing in all major regional and global sectors.
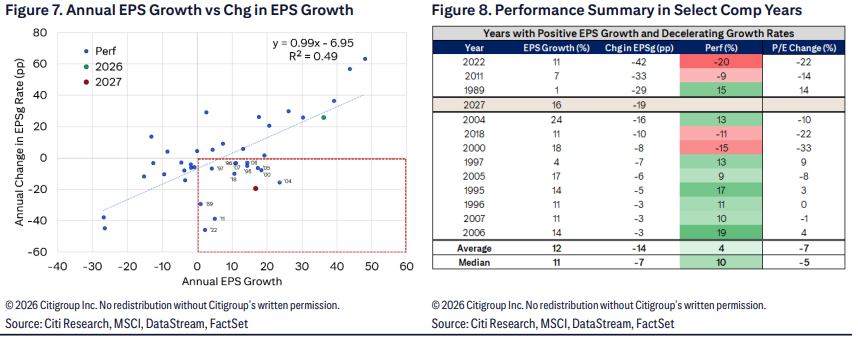
The consensus forecast for next year is +16%. Differences in regional growth rates have subsided, and are still significantly higher than the trend level. But the problem is the magnitude of the change: the deceleration of about 20 percentage points is one of the largest in Citi's sample dating back to the mid-1980s. The quantile comparison given in the report is quite illustrative - the 16% growth rate is at about the 71st percentile (higher), while the -20pp growth rate change is at about the 13th percentile (far below the historical average). In other words, the absolute level is not bad; what is bad is “acceleration.”
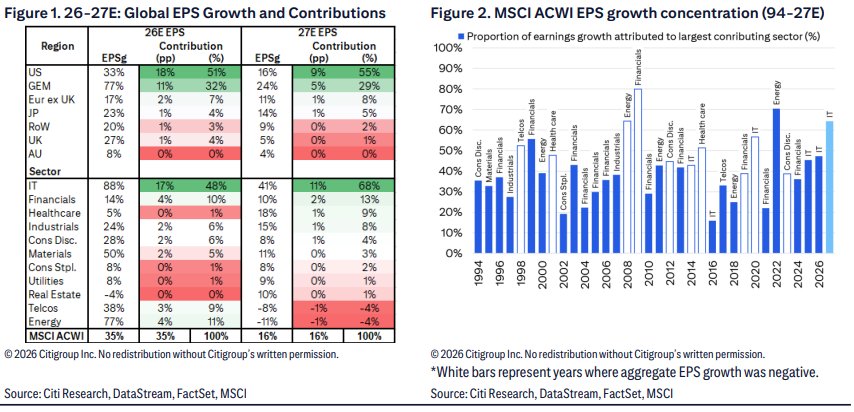
The two sets of simple regressions give a signal of fighting with each other: estimated at the level of growth, 16% corresponds to an increase of about +10% in the global stock index (+35% this year corresponds to about +20%, which is close to the actual performance from the beginning of the year to date); however, based on the change in growth rate, the deceleration of about 20pp corresponds to a basic leveling off of the stock index.
What does history say: average increase of 4%, median increase of 10%, but in four years it fell 15%
Citi therefore turned to a historical analogy and selected a year of “positive growth but deceleration” (comparable to 2027). The conclusion: MSCI ACWI increased by an average of about 4% in such years, a median increase of about 10%, and a probability of increase of 67% — the average was clearly lowered by a few years of sharp decline.
The four key negative samples are 2022, 2011, 2018, and 2000: the market declined by around 15% even though earnings were still growing positively. Citi suggests that two of them are particularly worth comparing — the commodity supply shock caused by the Russian-Ukrainian conflict in 2022 can be compared to current geographical risks; 2000 marked the top of the TMT bubble, which forms a parallel relationship with internet construction in the 1990s and the current AI capital expenditure boom.
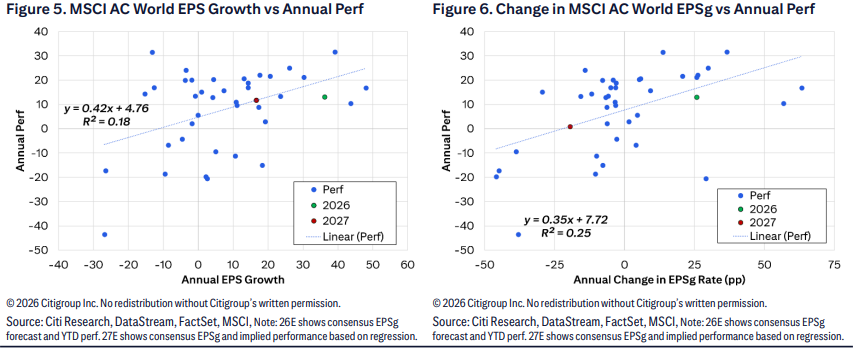
The results of the return breakdown point to a clear conclusion: in such years, profit itself was the main source of return, contributing about 10 percentage points; valuation multiples contracted averagely — but expansion was not impossible; about 30% of the years were revalued (1997, 2006). Citi also specifically responded to “whether killing valuation is equal to peaking”: profit growth in 1994 absorbed valuation compression, and profit slowdown in 1995 still recorded an increase; kill valuations from 2004 to 2005 were reported in double digits and continued until 2007; while the sharp contraction in 2000 and 2008 occurred simultaneously with the decline rather than early warning. Killing the valuation itself does not constitute a consistent signal of timing.
Second risk: 2027 may be the second “narrowest” profit year on record
Over the long term, the single largest contributor sector usually contributed about 40% of global EPS growth over 30 years (only counting the years of increase in positive contributing years). The technology sector, which contributed about half this year, will rise to about 70% next year (about 80% of the US market). This would make 2027 the second most concentrated year of positive growth on record — only the energy sector contributed more in 2022.
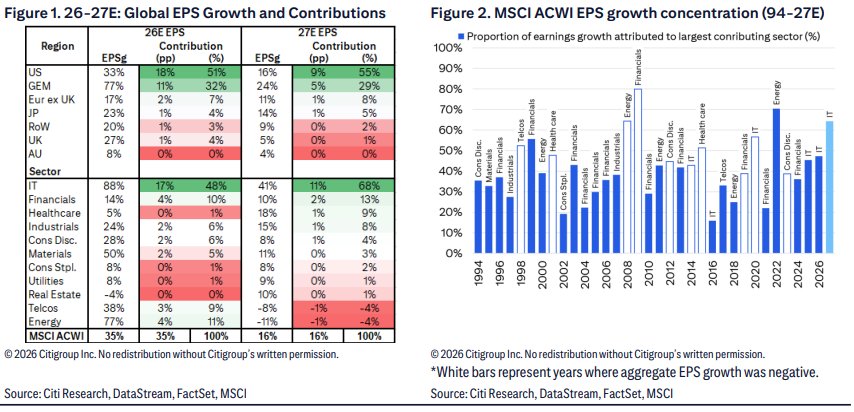
However, Citi emphasized that there is no clear relationship between concentration and overall market performance: putting the share of the largest contributor sector and MSCI ACWI's annual performance as a scattering point, there is no pattern to be seen. What is really regular is the sector's own behavior — sectors that contribute an extraordinary share tend to outperform that year, but their relative performance leveled off the following year: after a highly concentrated year, the original dominant sector mostly traded sideways in the first half of the following year, and only then outperformed slightly.
Here is a comparison of the present and past that is most worth writing about: The report points out that the TMT sector's contribution to profit growth peaked in 1998, but was only about 20% in 1999 and 2000, indicating that the sector's excess earnings at that time mainly came from revaluation rather than profit. In other words, the profit contribution of this round of technology stocks is real, which is different from the nature of the late Internet bubble.
Configuration conclusion: increase technology, choose only healthcare in defense
Based on the above, Citi maintains overallocation (OW) in the global technology sector because the trade-off between profit growth and traditional valuation multiples is still attractive, while acknowledging that AI sentiment will remain highly volatile. The defense sector as a whole is still neutral to low, but internal defense healthcare is its first choice — the US and Europe are all overequipped, which is highly consistent with historical rules. Citi's multi-path outlook continues until mid-2027, and is clearly “driven by profit growth, not valuation expansion.”
The report also lists styles and regional preferences in historical patterns: quality factors outperformed (both rising and falling years); value outperformed growth slightly (growth clearly outperformed in declining years, and the average was lowered by 2000 and 2022); defensive outperforming cycle (declining years were particularly obvious); there was almost no difference between large and small markets; health care and energy outperformed in the sector; the US and Europe outperformed on average in the region, and Japan's average return was negative. It is important to note that Japan is a historical analogy rule, and Citi still overrated Japan in the October 4 quarterly report. The two are at different levels, and there is no contradiction.
An inescapable counterproof: the bear market list is at its highest since the financial crisis
At the end of the report, Citi gave the hardest piece of evidence to the contrary. Its “Bear Market Checklist” (Bear Market Checklist) covers 18 indicators of market excitement, including valuation, leverage, capital expenditure, and IPO activity. The recent reading rose to 10.5/18, the highest level since the financial crisis. Currently, they are still sending positive signals and are two inflection points for Citi's key monitoring. Investment-grade (IG) and high-yield (HY) credit spreads are still relatively tight.
The continuity of profit improvement is also listed as an observation item: it is rare for profit expectations to continue to be revised in history; it only occurred on the eve of the financial crisis and in recent years. The market is currently still recording relatively optimistic profit results (single-digit percentage increase) for the next 12 months, and once the upward pace is interrupted, it will be the most alert sign.
Market background: AI transactions have just experienced a round of repricing
The timing of this report's implementation is quite delicate. Chip technology stocks collectively declined on Wednesday. Broadcom CEO Hock Tan (Hock Tan) compared part of the money flowing into the AI sector to “casino gambling.” Julien Lafargue, chief market strategist at Barclays Private Bank, said at the time that the market is increasingly aware that the chip industry “is a cyclical industry after all,” and that the schedule for increased competition may be brought forward to next year. Inflation data is further pressurized. The US CPI rose 3.7% year over year in September (3.4% in August), higher than the forecast of 3.6%; the core CPI rose 2.6% year over year, higher than the forecast of 2.5%. Interest rate futures are pricing this month's rate hike higher than before the data was released.
Citigroup's statement on this environment in its October 4 quarterly report was that the Federal Reserve's first rate hike “usually causes the market to fluctuate, but rarely ends the bull market”. As long as economic growth remains resilient, the impact of rising long-term interest rates is still within an acceptable range; strategically, it is recommended to adopt a barbell strategy that places equal emphasis on cyclical stocks and growth stocks.