


Hotter US inflation data in September has put interest rates back in focus, which keeps reliable income more valuable for investors counting on regular cash flows. Canadian dividend payers that aim to grow payouts while keeping yields in the 2% to 5% range can offer a middle path between low-yield safety plays and high-yield risk. This article walks through three such stocks from that group.
The three stocks highlighted below are a sample from this group, while the full screen surfaced 8 more companies with similar income profiles and payout stories that are not covered here.
If you want to identify the Type 2 dividend ideas that best fit your own risk and yield targets, head straight into the Growing Dividend Payers with 2-5% yield screener
Royal Bank of Canada (TSX:RY)
Royal Bank of Canada is a diversified financial institution that fits this screener through its recurring earnings from everyday banking and wealth management, which help fund a growing dividend while the larger corporate and markets operations add extra fee and trading income.
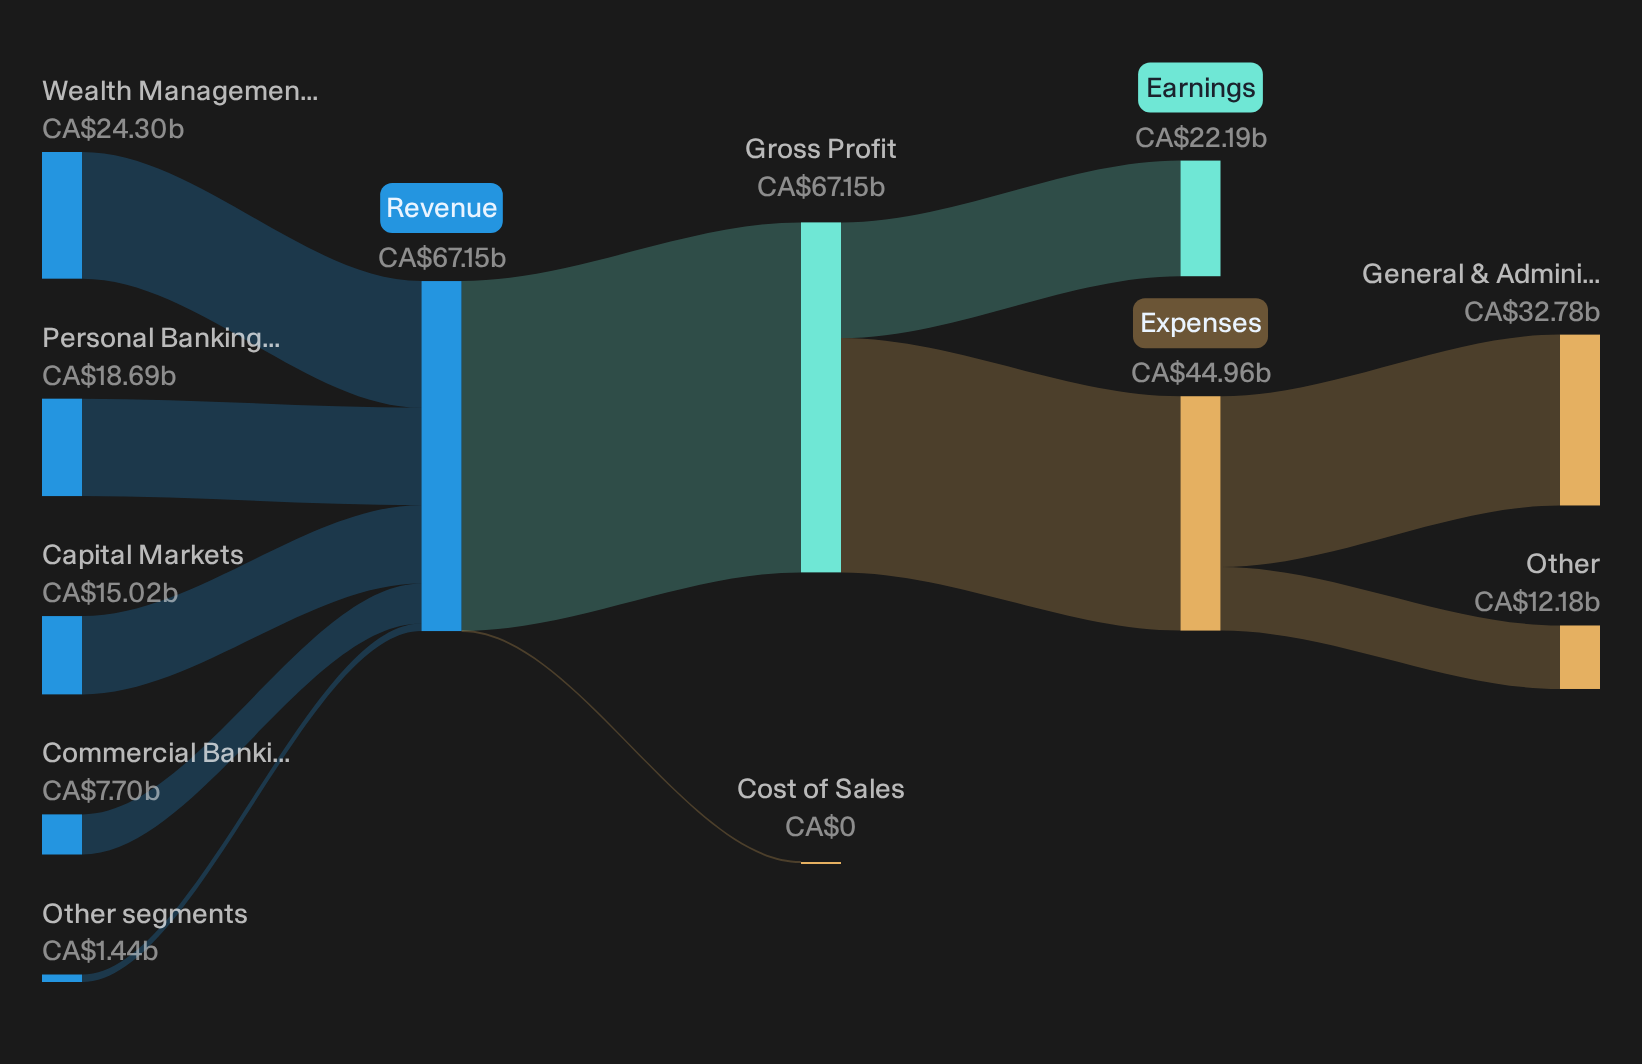
Royal Bank of Canada earns about CA$18.7b from Personal Banking, CA$7.7b from Commercial Banking, CA$24.3b from Wealth Management, CA$1.2b from Insurance, CA$15.0b from Capital Markets, and CA$0.2b from Corporate Support, and has a market value near CA$382.1b.
That steady, payout friendly profile is now being layered with something more ambitious on the efficiency side.
"Expanded use of AI and advanced analytics at Royal Bank of Canada, including over 200 production models and a stated target of $700 million to $1 billion in net AI driven enterprise value by fiscal 2027, is expected to support lower operating costs, higher staff productivity and more targeted product penetration, which would feed through to net margins and earnings."
What happens to those carefully managed margins if one unseen pressure on the cost base or fee pool shifts faster than management expects?
If that kind of unseen pressure worries you, read the full narrative for Royal Bank of Canada to see how Royal Bank of Canada’s AI push could offset cost creep and reshape earnings power.
Bank of Montreal (TSX:BMO)
Bank of Montreal leans on its Canadian Personal and Commercial Banking arm for steady deposit and lending income that can support sustainable dividend increases, while its broader US banking, wealth and capital markets operations add multiple fee streams and keep the overall earnings engine diversified.
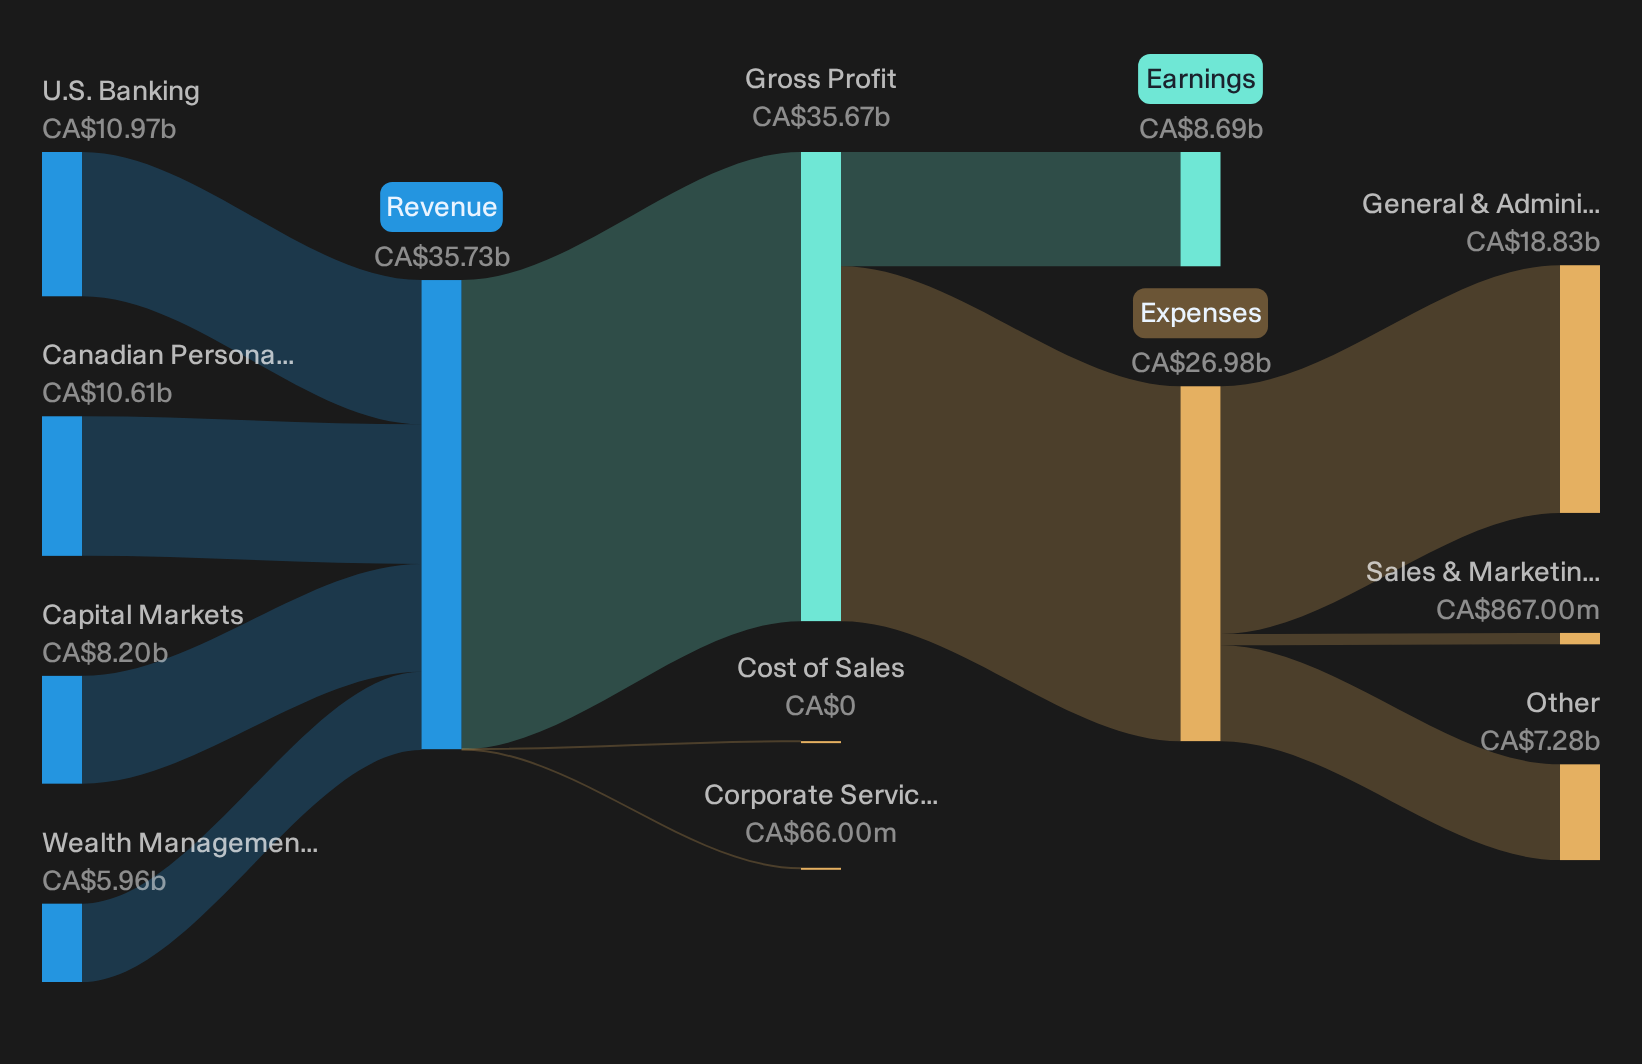
Bank of Montreal generates about CA$10.6b from Canadian Personal and Commercial Banking, CA$11.0b from U.S. Banking, CA$8.2b from Capital Markets and CA$6.0b from Wealth Management, with Corporate Services at roughly CA$66m, and the bank carries a market value near CA$162.1b.
That combination of dependable Canadian P&C cash flow and growth-oriented US and capital markets income helps Bank of Montreal fit this screen as a Type 2 dividend payer that aims to expand its payout in line with sustainably rising earnings, rather than chasing headline yield.
"Continued investment by Bank of Montreal in digital and AI powered banking tools such as SmartDecision underwriting, the Lumi chatbot and GenAI automation pilots is expected to support the targeted $1 billion PPPT benefit by 2030, which would mainly flow through improved efficiency, net margins and earnings."
The real swing factor sits in how one unresolved cost and credit pressure ultimately shapes those future margins and dividend headroom.
That unresolved pressure is exactly why reading the full narrative for Bank of Montreal can be useful, as it connects those cost and credit threads to Bank of Montreal's dividend runway.
Stella-Jones (TSX:SJ)
Stella-Jones leans on its pressure-treated wood utility poles and railway ties to supply the steady, infrastructure-linked cash flows that fit this 2 to 5% dividend theme, with about CA$3.5b from Pressure-Treated Wood and CA$62 million from Logs and Lumber, and a market value near CA$3.5b.
For dividend investors, Stella-Jones is interesting because most of its cash comes from long-life infrastructure products that support recurring orders and predictable payouts, rather than one-off construction cycles or highly volatile commodity swings.
"Stella-Jones has significant exposure to a structural shift toward steel and composite poles as utilities invest in grid modernization and undergrounding, which could erode long-term demand for its core wood utility pole products and pressure revenue and margin expectations in years ahead."
What really matters is how one slowly building shift in buyer preferences and grid design ultimately filters through to pricing power and margin headroom.
That slow shift is exactly why the full narrative for Stella-Jones examines how Stella-Jones could adapt, defend pricing power and keep cash flows working for income focused investors.

Curious About What Else You Could Be Exploring
Fresh ideas move first. By the time momentum stories hit headlines, ideal entry points can be gone. Scan these under the radar lists before the crowd catches up and act now.
- Target robust cash generators as you review the list of solid balance sheet and fundamentals (8 results) that focuses on resilient businesses before their next breakout attracts wider attention.
- Ride structural demand in essential materials by checking the 16 top copper producer stocks poised to benefit if metal markets regain momentum while they remain under the radar for now.
- Catch early movers in a niche energy build out when you scan the 16 nuclear energy infrastructure stocks that filters for potential beneficiaries before sentiment starts flying.
This article by Simply Wall St is general in nature. We provide commentary based on historical data and analyst forecasts only using an unbiased methodology and our articles are not intended to be financial advice. It does not constitute a recommendation to buy or sell any stock, and does not take account of your objectives, or your financial situation. We aim to bring you long-term focused analysis driven by fundamental data. Note that our analysis may not factor in the latest price-sensitive company announcements or qualitative material. Simply Wall St has no position in any stocks mentioned.
Have feedback on this article? Concerned about the content? Get in touch with us directly. Alternatively, email editorial-team@simplywallst.com