


I have some relatives and friends who are “can’t miss” investor types. As in, they can’t miss being in the wrong place at the wrong time.
Sort of like when I’m driving in the center lane on I-95 on my way south to Gulfstream Park, as I often do on a weekly basis. We all have our happy place; that’s mine. Or as I call it, my “Hallandale Beach office.” It’s a great environment to get away from the desk and concentrate for 25 minutes at a time, then pause for two minutes to watch a race live, right in front of me.
But the drive there, and especially back, can be the toughest part of the day. That road is notoriously crowded. To make it worse, the weekday racing program typically ends around 4:30 or so, right as the traffic is picking up.
So what do I do – as a patient investor but notoriously impatient driver – on the way home? The same thing I do in a stock market filled with bad drivers, lots of noise, and overcrowding.
I look for tactical opportunities to get ahead, while also realizing those windows tend to open and close quickly. And just as critically, I acknowledge that many of those opportunities are not worth taking. “High percentage shots” only, please.
What Does This Have To Do With Investing In 2026?
Only everything.
If I am forced to narrow down the current market climate for risk-manager types like me, and characterize it accurately, here’s what I have.
- People still think that what used to work still works. The algorithms are laughing at us. Still thinking you can put 60% of your money in stocks, 40% in bonds – and do it through your 401(k) plan or wealth advisor – and get to where you want to, on time and safely? You might as well be trying to get to Pembroke Pines from Hollywood, by way of Jacksonville. (If you’re not a Florida Man, a map will help with this reference.)
- The whole concept of asset allocation is based on archaic market conditions that were last relevant around the time the New Orleans Saints won the Super Bowl back on Feb. 7, 2010. (It was a decisive win over the Colts at 31-17, and reporters at Dad Jokes Daily at the time characterized the win as a “Brees.”).
- The stock market suffers from a massive case of FOMO and complacency. The bond market can check that second box too, albeit for a very different reason.
The stock market has had such a monstrous run the past 17 years, it caused the investment management world’s “easy button,” known as the 60/40 portfolio, to appreciate like this.
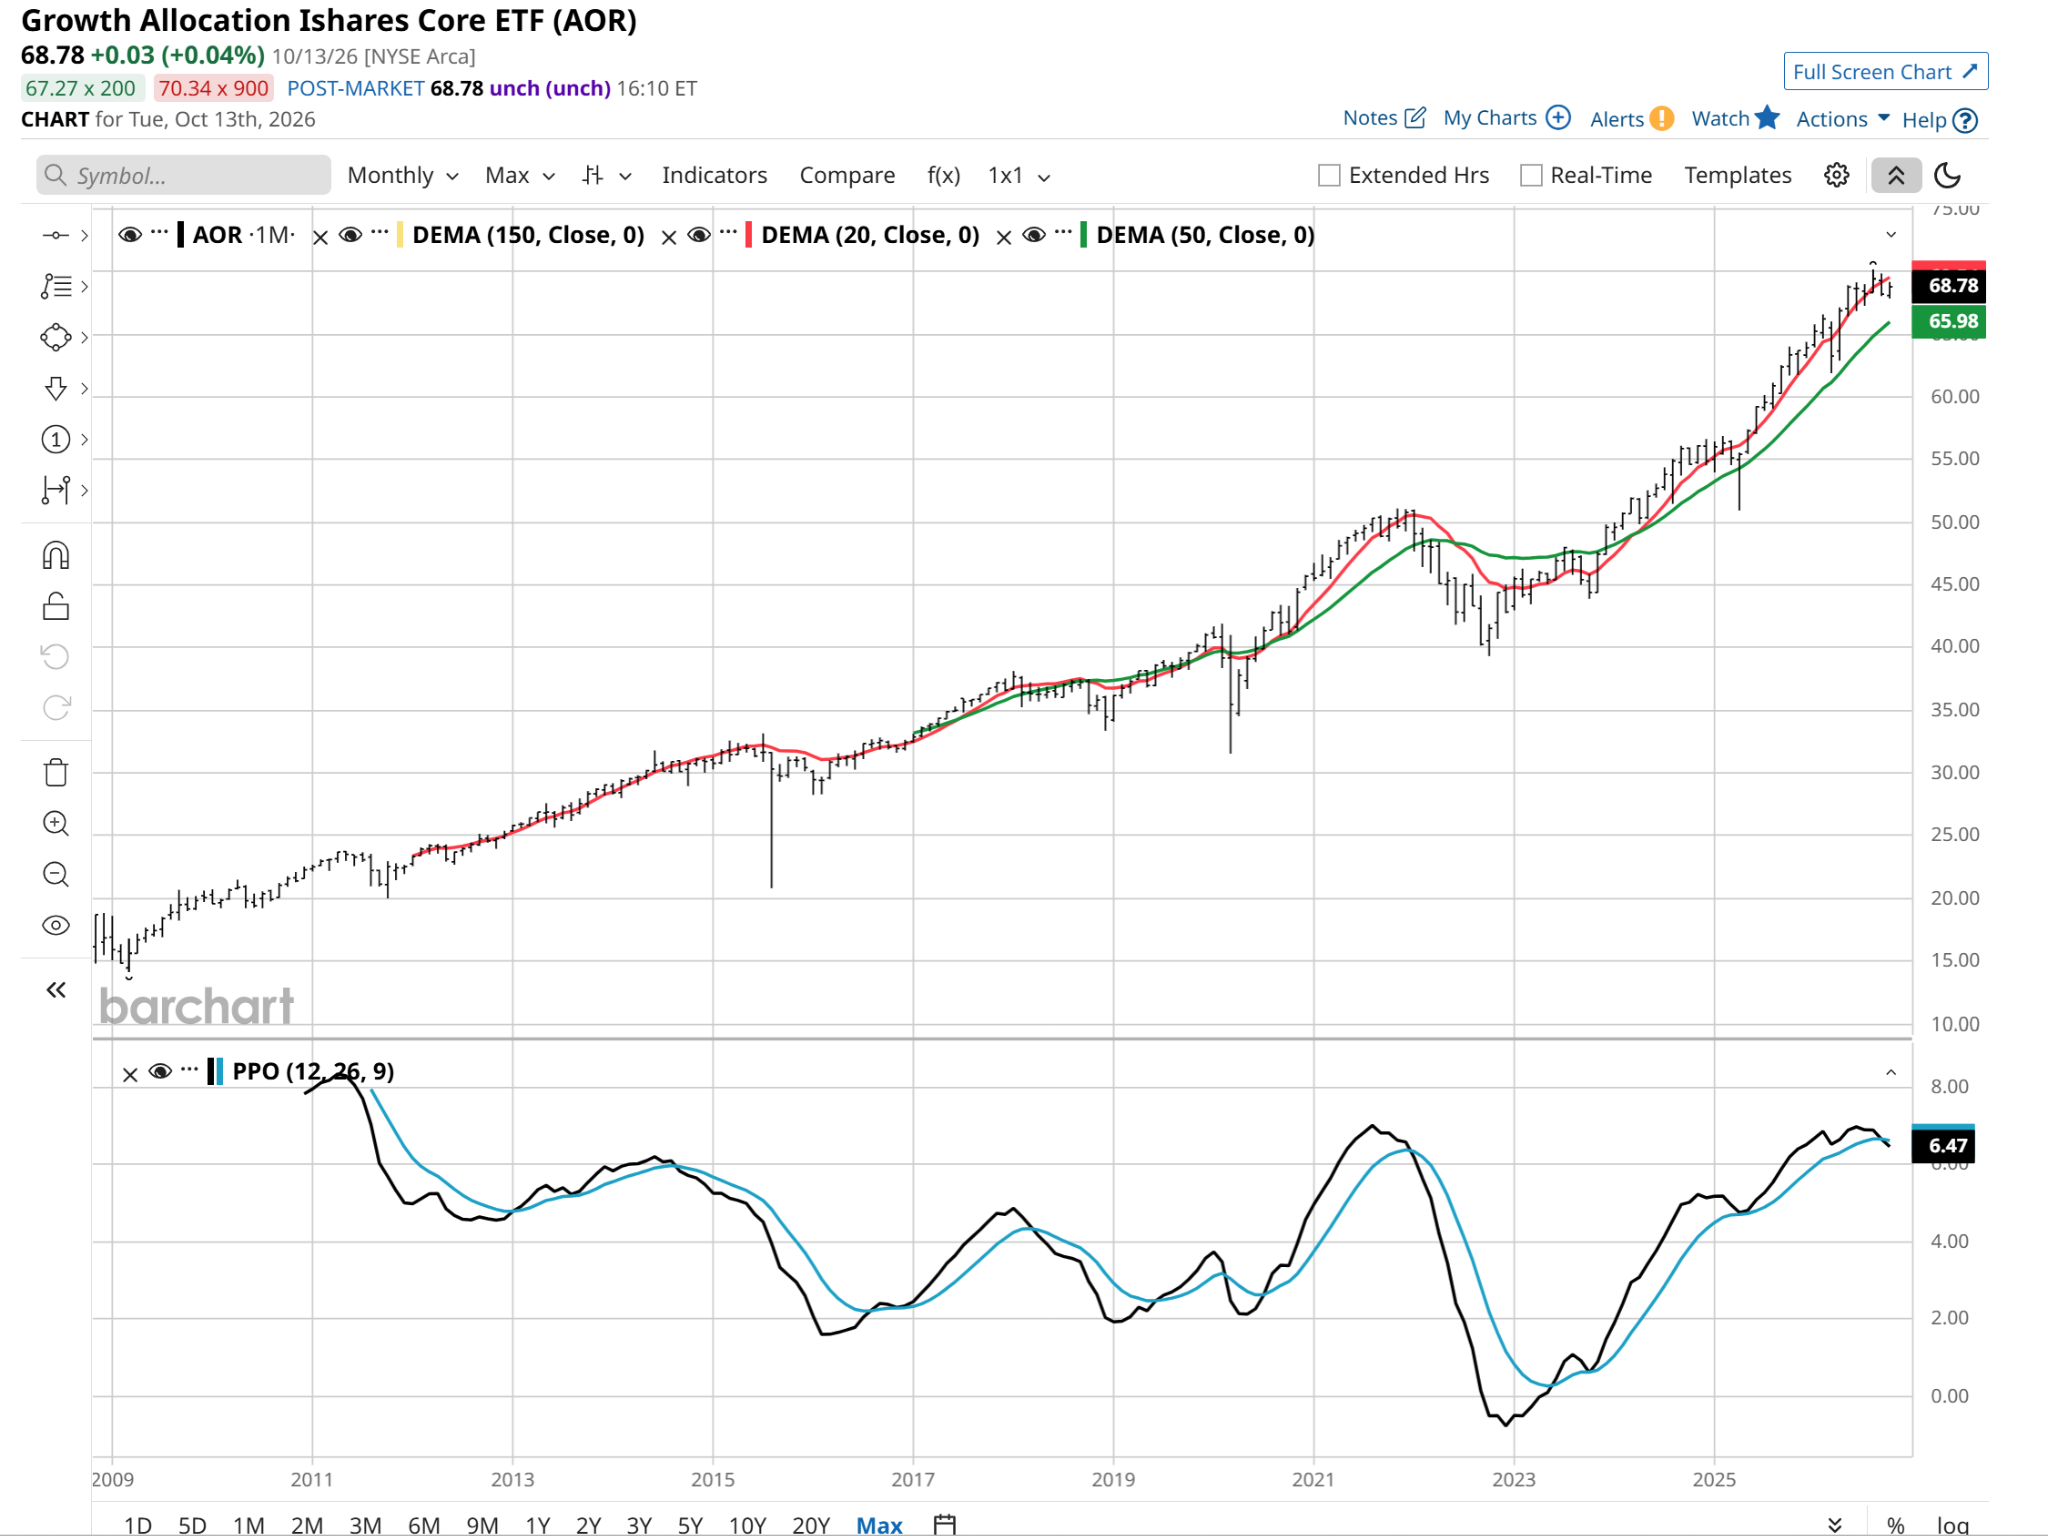
That’s the iShares Growth Allocation ETF (AOR). AOR is one of a foursome of funds from iShares which promise to make “diversification” into a boilerplate allocation of stocks and bonds as easy as a single trade. There are ETFs for Conservative Allocation (30% stocks / 70% bonds), Moderate (40/60), Aggressive (80/20) and the iconic one in the eyes of many, the 60/40 blend – all but guaranteed to ward off evil spirits, including bears.
Past Performance vs. Future Returns
An investment in AOR to start 2009, around $15 a share then, is worth nearly $70 now. The technical term for that in pro investing circles is “dang good living!” And thus, 60/40 investing’s current weaknesses can be hidden behind the old chestnut of “a great track record.”
As someone who spends a decent amount of time at the racetrack compared to the average investor, I’ll offer this: your odds are not as good going forward as they were in the past.
In horse racing, the favorite wins about one-third of the time. And even those chances can be impacted by a variable as minor as a change in surface (turf, dirt, or this new synthetic thing called Tapeta) or climate.
Case in point: One of the horses we own – under a partnership I co-created to offer “regular folks” the opportunity to own racehorses without taking on a second mortgage – ran last weekend at Gulfstream. He was the prohibitive favorite, going off at odds of 3-5. That means he was very likely to win… on paper.
He finished a strong second. Good for the owner group, as it's a decent check. And better than finishing 7th, which would have been very discouraging – since two horses scratched the day of the race, so only five ran. Furthermore, he ran against a tough peer group. So all in all, a nice outcome this time around.
I’m the “horse’s mouth” of the team, given my communications background. So after the race, I asked my horsemen-partners what factors they thought could have tipped the scales in our favor. The response made a lot of sense: “Cooler weather.”
It was 93 degrees at race time. This horse had raced 19 times in his career – but this was the first time for us, as we acquire horses out of “claiming” races, where every horse has a price tag attached to it.
The catch: those previous 19 races were run in California, and specifically at Del Mar and Santa Anita, two beautiful venues that rarely get temps in the 90s.
I noticed the horse was a bit antsy prior to the race, and apparently, the heat was a factor. He was no different than us humans that day. “Dad, can’t we race inside,” I imagined him saying.
Just as in horse racing, conditions matter in investing. And as I’ve argued here frequently in my role as “the horse’s mouth” (or horse’s backside, to my less enthused readers), today’s market does not offer the same investing conditions we had during the golden era of 60/40 investing.
What If the SPY Rally Turns Into a Slow Horse?
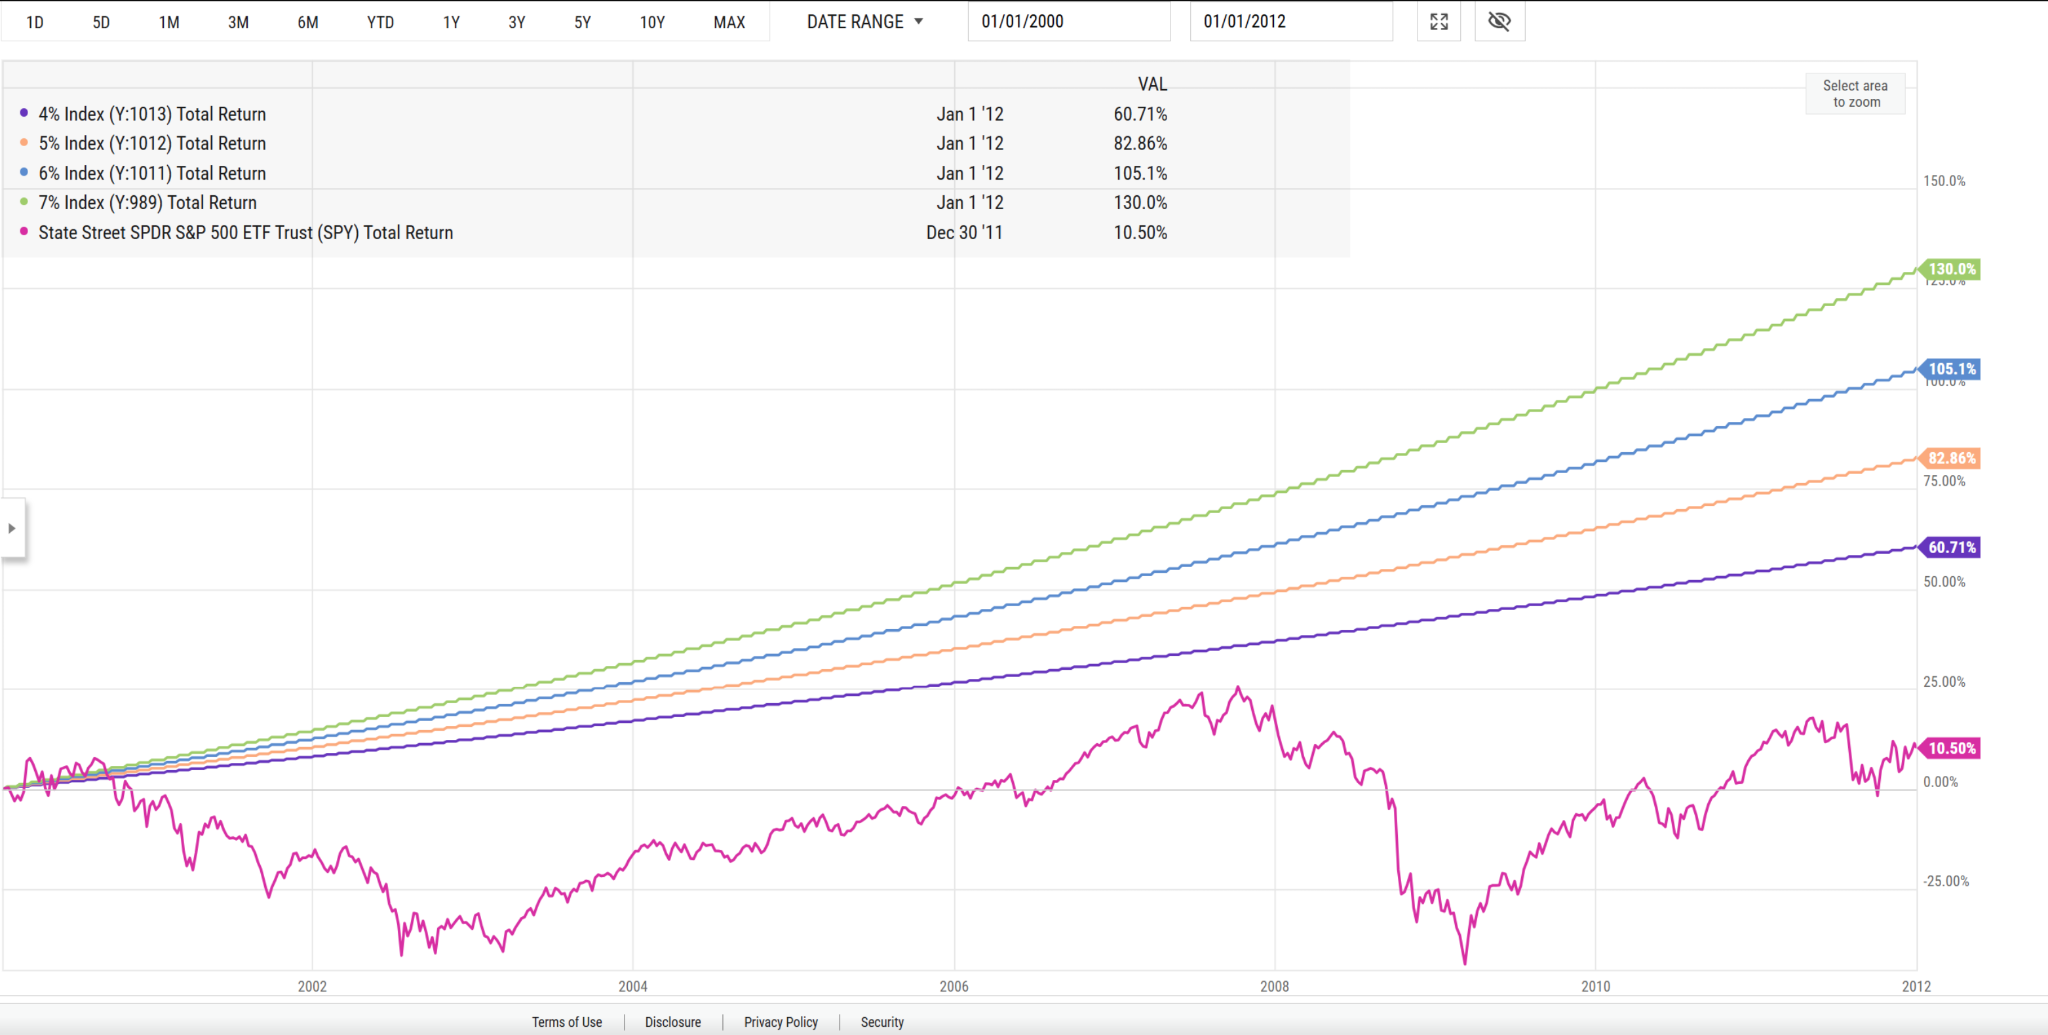
During this 21st century, we’ve already had a (now-forgotten) 12-year period in which the S & P 500 Index ($SPX) returned about 10%. Not per year, as the popular wisdom implies about long-term stock market returns; 10% in TOTAL for the 12-year stretch. Including dividends!
Here’s what that looked like, from the start of 2000 through the start of 2012. I managed “other people’s money” throughout that period. People saving for retirement at the time, or those who were already in it, did not assume the stock market would be the “fast horse” they rode from the starting gate to the finish line wire.
They needed help, and they got it from bonds.
Rates fell hard after the 2008 global financial crisis. That covered the equity market’s skittish run, since rates dropping from around 6% to nearly 0% created the best bond return era in modern history. That’s what happens when you have an asset class (bonds) whose value is determined primarily by levels of interest rates – not earnings and valuation, as is the case with stocks.
The bond market is sort of the mature older sibling, whereas the stock market is that popular kid who – when they are “on” – they are the toast of the class. But occasionally, about 25% of the time, when stocks are “off”... well, they can take the whole market’s mood down with them.
As you can guess from this analogy, as well as just about every article I’ve ever written here, I’m the bond market in this hypothetical example. I can be fun, but there’s a good chance the majority of kids in the class will never bother to understand me well enough to benefit from that.
The other drawings on that last chart above are “what if” scenarios. What if you started in January 2000, and made exactly a 4% return, in a straight line, for the next 12 years? That’s the purple line.
The orange, blue and green lines are the same concept, but for 5%, 6% and 7% annual returns. That jagged little pill of a pink line (with a tariff-free olive branch extended to Canadian icon Alanis Morrissette)? That’s the S&P 500 ETF (SPY).
I should also point out that by early March 2009 – more than eight years into that 12-year time frame – SPY was STILL more than 45% below where it started the year 2000.
Take a minute to cool off before we continue. Sort of like how they hose down the horses after a race… especially when it is still 93 degrees outside in October!
2 Takeaways and Some New Math on 60/40
Two takeaways to highlight at this point in the discussion:
#1: The stock market isn’t what you think it is. The past several years have been abnormal. Take it from a guy who’s seen 40 full years of this. SPY’s continued stability near all-time highs has de-sensitized many investors, creating the widespread belief that 60% in stocks is a great long-term allocation. And it could be, but not if SPY takes a header like the ones we’ve seen several times in modern history. Particularly following extremely positive periods like this one.
#2. The bond market isn’t what many assume, either. A whole generation (or two) of investors did not ever experience a time when bond investing, the 40% of that 60/40 mix, mattered. For years, it was essentially treated as a fancy word for cash or Treasury Bills – that thing that just makes 5-6% a year.
Some simple math may help here:
- 40% in bonds at a 5% annual return = 2% contribution to the total
- 60% in stocks at a 10% annual return = 6% contribution to the total
Add ‘em up, and we get 8%. Easy peasy. Don’t we feel like we just found the investing version of a “happy medium?”
Now you know how much fun it was for investment advisors to settle for 60/40 mixes, in cookie-cutter fashion, and hundreds of billions of dollars into “balanced allocation” funds.
AOR is small in comparison to offerings from the mutual fund giants, the 401(k) plan sponsors, and separately-managed account providers. All for a “product” that stopped working the way it used to, several years ago.
60/40 Isn’t Broken. It’s Just Overrated – And Over-Simplified.
T-bills are again competitive. And bonds certainly are. But as I have and will continue to argue here, my bond allocation is not something I view as part of an asset allocation mix. It is a ballast, a 5%+ long-term baseline return.
That’s why in my own portfolio, the formula is not 60 + 40. Or even 40 + 60. It is this:
- A Hedged Bond portfolio I modeled for myself and my subscribers, which lays out a “laddered” set of ETFs that own Treasury securities, and close out like a maturing bond does, at the end of the year it is targeted for. That’s the anchor, the core. Around it, I trade other ETFs, depending on my view of opportunities in the bond/rates/income markets – but with the priority of hitting that long-term 5% minimum return target.
- A “go-anywhere” portfolio of ETFs and stocks I call ROAR Flex, which is essentially the current iteration of the strategy I’ve run since the 1990s, and throughout the decades when I was an advisor and fund manager.
- Trading accounts, just as I describe here regularly. This involves small position sizes, renting instead of owning long-term, and frankly just looking for those higher-percentage entry points, as I do in traffic on I-95 at 4:52 PM on a typical Friday.
If we all don’t outperform the 5% that 5-year bonds now pay over the next half-decade, shame on us! It means that whatever risk we took was not sufficiently rewarded.
We could have spent more days lounging at the track – which in my case, means a nice restaurant, a great view at a unique restaurant called Ten Palms, and enough stimuli to feel like I’m on a trading desk. There’s a TV at the table, people buzzing (and screaming at times) around me with multiple tracks televised at once, my iPad and Chromebook PC, plus my phone, which all fit nicely into my backpack.
And yes, I just sit there all afternoon, in the Florida sunshine, and trade, write articles for Barchart, and think about what else I can do to help self-directed investors and pros alike get in sync with the new realities of bond investing and stock investing. And, of course, the fallacy of the 60/40 portfolio.
Rob Isbitts is a semi-retired CIO, former fiduciary investment advisor, Barchart columnist, and straight-talker. Download his new free e-book on hedged bond investing for retirement at ETFYourself.com. His research and model portfolios are at ROAR.PiTrade.com.
On the date of publication, Rob Isbitts did not have (either directly or indirectly) positions in any of the securities mentioned in this article. All information and data in this article is solely for informational purposes. For more information please view the Barchart Disclosure Policy here.