


- PLS Group has approved a final investment decision for the A$1.3b P2000 expansion at Pilgangoora, targeting a near doubling of spodumene concentrate capacity by 2029, funded primarily from existing cash and operating cash flow.
- The P2000 build strengthens PLS Group’s position as a large scale, low cost lithium hub. It also concentrates execution risk and future cash demands into a single, capital heavy project.
- We will look at how PLS Group’s investment narrative evolves as the A$1.3b P2000 Pilgangoora expansion moves from concept to committed build.
Scan for other lithium producers building out capacity and capital heavy projects with our hand picked 32 best rare earth metal stocks, which echo the scale and ambition of PLS Group's Pilgangoora expansion.
PLS Group Investment Narrative Recap
To own PLS Group, you need to be comfortable with a lithium pure play that is leaning hard into Pilgangoora as a big, low cost production hub. The short term story still hinges on how efficiently that mine runs and how well costs are contained as output steps up from the FY26 record and moves toward higher FY27 guidance.
The fresh P2000 final investment decision makes execution risk and capital intensity the main near term swing factors. Higher unit costs flagged into FY27 and heavier spend now concentrated in one A$1.3b project mean cash generation sensitivity increases, but the core thesis around Pilgangoora throughput and recoveries does not materially change.
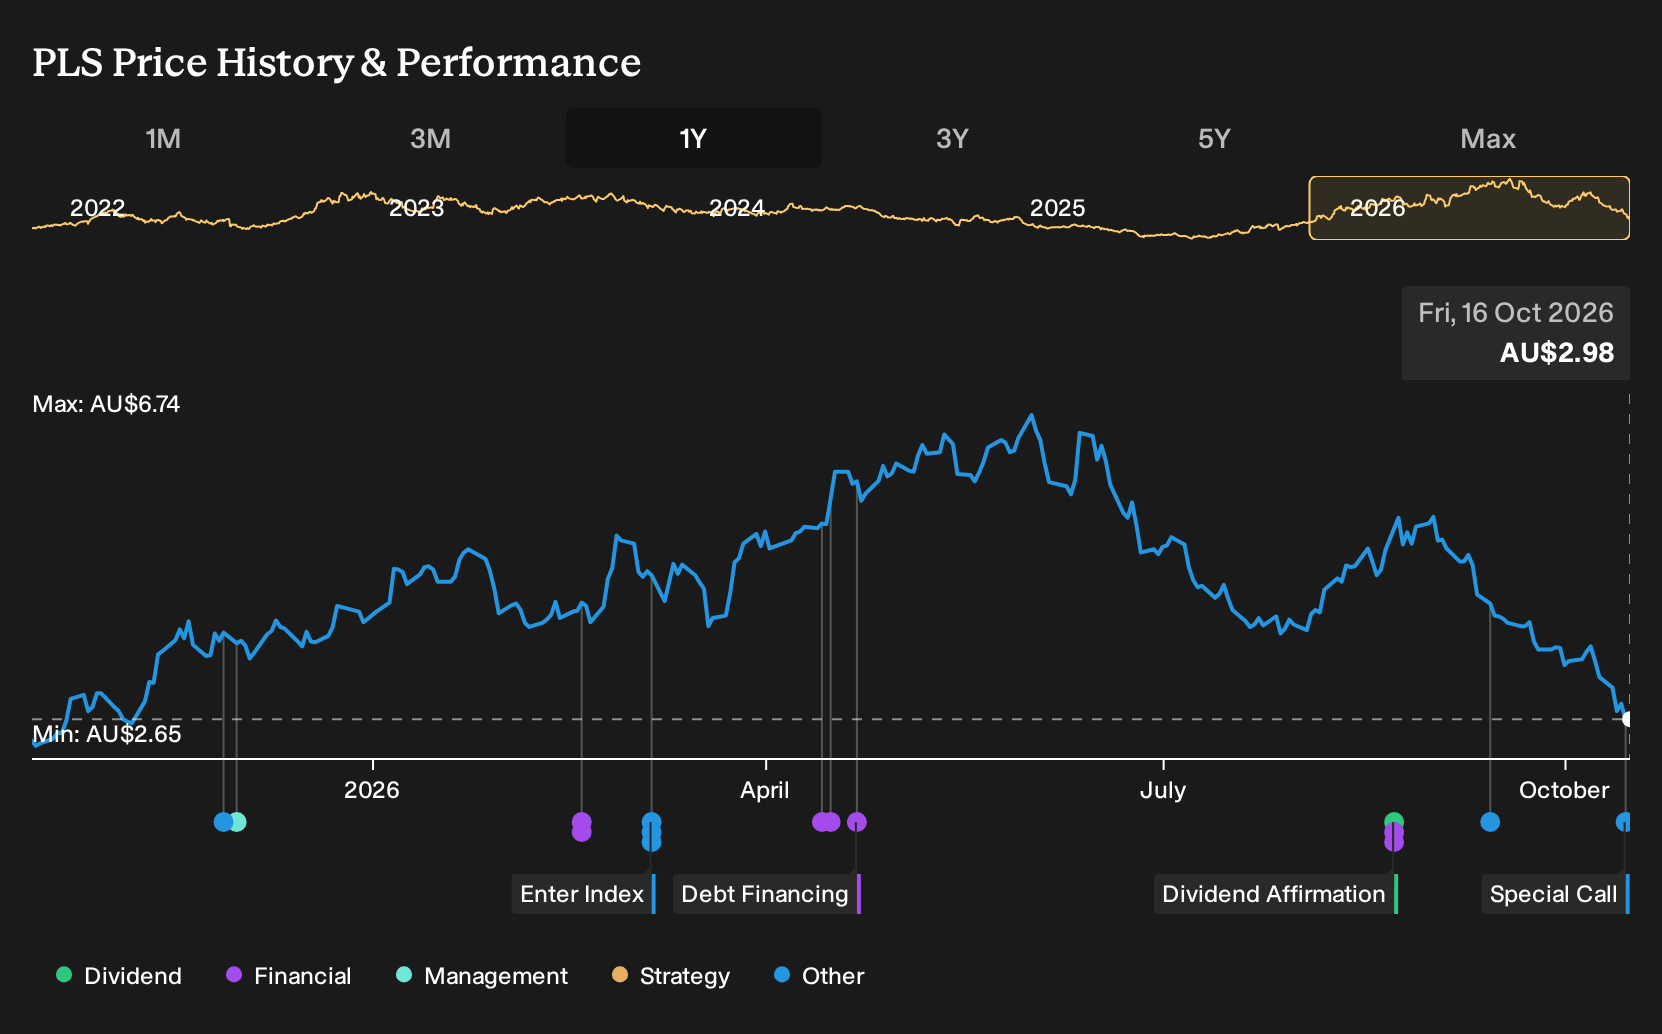
The most relevant development here is the special call on 15 October 2026 to walk investors through P2000 outcomes and the final investment decision. That briefing ties directly into existing catalysts around volume growth, process recoveries and the midstream lithium phosphate plant as management explains how the enlarged Pilgangoora flowsheet is expected to work in practice.
For you as a shareholder, the value of that call sits in the extra detail on project phasing, cost expectations and funding flexibility, including the option to introduce debt on top of current cash and operating inflows. Execution milestones, commissioning timing and any change in guided FY27 capex or operating costs now become key markers to watch against the larger P2000 build.
What The Current PLS Group Forecasts Are Asking You To Believe
PLS Group's narrative projects A$2.4b revenue and A$844.1 million earnings by 2029. That profile assumes 7.5% yearly revenue growth and an earnings increase of about A$318 million from A$525.8 million today.
Analysts are effectively sketching out a future Pilgangoora that is larger and more profitable on each tonne produced. The forecast move in profit margin from 27.2% to 35.1% by 2029 implies not just volume growth but tighter process control, a cleaner cost base and helpful product mix from the broader Pilgangoora complex.
The jump in earnings from A$525.8 million today to A$844.1 million by 2029 is substantial in absolute terms. For you, the central question is whether a higher margin Pilgangoora, together with projects like P2000 and the lithium phosphate plant, can realistically support that step up while still funding the A$1.3b expansion and other capital commitments.
Consensus also assumes PLS Group trades on a P/E of 25x those 2029 earnings compared with 20.7x today and an industry multiple of 11.6x. That implies the market would need to ascribe a significant quality premium to the business on the back of a larger, longer life operation and a stronger midstream position.
The same forecasts build in modest share count growth of 0.14% per year over the next 3 years. Even though that level of dilution is small, it still slightly slows earnings per share progress, so you need to be comfortable that operational delivery at Pilgangoora outweighs that drag.
On these numbers, analysts land on a consensus price target of A$5.05, with a wide spread between A$3.1 at the low end and A$6.7 at the top. That range reflects how differently people are weighing the upside from P2000 and higher margins against the execution risk and commodity exposure.
Uncover why PLS Group's fair value indicates a 69% potential upside to its current price, which could narrow quickly.
Exploring Other Perspectives
One alternate view puts PLS Group’s capital burden front and center. Bearish analysts worry that heavier P2000 and midstream spending could strain future cash, which helps explain why they were only pencilling in about A$1.9b revenue and A$600.2 million earnings by 2029. That A$3.1 price target signals a far more cautious story. With the fresh P2000 call now on the table, those numbers may shift. Use this as your cue to compare both narratives and decide which assumptions you trust.
Explore 5 other PLS Group fair value estimates, including one that suggests it could be worth just A$3.10.
Decide For Yourself
Don't just follow the ticker. Dig into the data and build a conviction that's truly your own.
- A great starting point for your PLS Group research is our analysis highlighting 3 key rewards that could impact your investment decision.
- See our latest analysis for PLS Group. The report includes a comprehensive fundamental analysis summarized in a single visual, the Snowflake, making it easy to evaluate PLS Group's overall financial health at a glance.
Looking For More Ideas Beyond PLS Group?
If PLS Group is on your radar, it can help to compare its story with other listed businesses that share similar risk or quality traits. Use the Simply Wall St Screener to line up alternatives side by side and stress test where PLS Group really fits in your portfolio.
- If you want potential value with quality fundamentals, scan a curated pool of 4 high quality undervalued stocks that pair solid balance sheets with reasonable prices.
- For steadier profiles, weigh PLS Group against 6 resilient stocks with low risk scores that score well on financial strength and earnings stability.
- If you prefer strong finances and clean accounts, compare PLS Group with a list of solid balance sheet and fundamentals (12 results) to see which businesses better match your risk limits.
This article by Simply Wall St is general in nature. We provide commentary based on historical data and analyst forecasts only using an unbiased methodology and our articles are not intended to be financial advice. It does not constitute a recommendation to buy or sell any stock, and does not take account of your objectives, or your financial situation. We aim to bring you long-term focused analysis driven by fundamental data. Note that our analysis may not factor in the latest price-sensitive company announcements or qualitative material. Simply Wall St has no position in any stocks mentioned.
Have feedback on this article? Concerned about the content? Get in touch with us directly. Alternatively, email editorial-team@simplywallst.com