


lululemon athletica (LULU) is back in focus after a leadership shake-up intersected with a weaker outlook, multiple securities investigations, and fresh volatility in the share price. Investors now have several moving parts to weigh.
Recent news around reduced guidance, investigations, and the leadership overhaul has landed on a stock that was already under pressure, with the latest 1-day share price return down 2.01% and the 90-day share price return down 16.53%. That weak short-term momentum sits on top of a much steeper slide, as lululemon athletica’s year-to-date share price return is down 53.94% and the 5-year total shareholder return has fallen 76.98%. Taken together, these moves point to a long reset in how the market now prices its growth prospects and risk profile.
Spot 33 high quality undervalued stocks that have been hand-picked for stronger fundamentals if you want to balance lululemon athletica’s current pressure with other ideas on your watchlist.Bulls view lululemon athletica as a reset story after a sharp selloff. Bears see a business under legal scrutiny with falling sales. Which side does the current valuation lean toward as the next step?
Most Popular Narrative: 30% Undervalued
At a last close of $97.10 against a most-followed fair value estimate of $139.00, the narrative on lululemon athletica frames today’s price as valuing a high return business on what the author calls “headache, not tumor” terms, even while acknowledging how messy the recent quarters have been for the brand and its leadership.
The math here is not heroic, but it is sensitive. Run a discounted cash flow with low-to-mid-single-digit revenue growth, partial free-cash-flow margin recovery, a 9% discount rate, and a 2.5% terminal. A haircut base case lands around $205 a share. Let margins recover closer to their old normal and you get roughly $220. Push the inputs to pessimism and you land closer to $135. The stock is at $143.
See why 50 investors see lululemon athletica as 30% undervalued.
That valuation work, according to tripledub, uses an 8.83% discount rate and lands at a central fair value of $139.00. This is still above the current market quotation even after the subsequent reset in Americas demand and guidance. The same storyline now leans more heavily on the idea that the price has started to reflect a meaningful chance that lululemon athletica earns margins closer to Nike over time rather than its own history. This is why the author spends as much time on what would break the thesis as on the potential upside.
The narrative flags several anchors that readers can pressure test. Revenue of $11.09b and net income of $1.42b support the argument that this is still a profitable apparel platform, but the annual revenue slipped about 0.7% and earnings declined 5.4%. This is a very different backdrop to the high-teens growth described earlier in tripledub’s original piece. A required return closer to 11% to 13% is implied in the updated ranges, which sits above the 8.83% discount rate that underpins the $139.00 intrinsic value and helps explain why the author now describes the price as “inside my own range of doubt” rather than an obvious bargain.
Readers following the valuation story can also compare that $139.00 narrative fair value with the $84.13 future cash flow value from the SWS DCF model, which currently points to the shares trading above that particular estimate. The gap between those two frameworks highlights how sensitive long run outcomes are to assumptions on margins and revenue paths when the market already prices in revenue declining 0.7% a year and earnings falling 5.4% a year over the next three years.
Result: Fair Value of $139.00 (UNDERVALUED)
Still, the most-followed fair value story for lululemon athletica leans heavily on margin resilience and brand strength, both of which recent data have called into question.
Find out about the key risks to this lululemon athletica narrative.
Another View: lululemon athletica Through a Simpler Lens
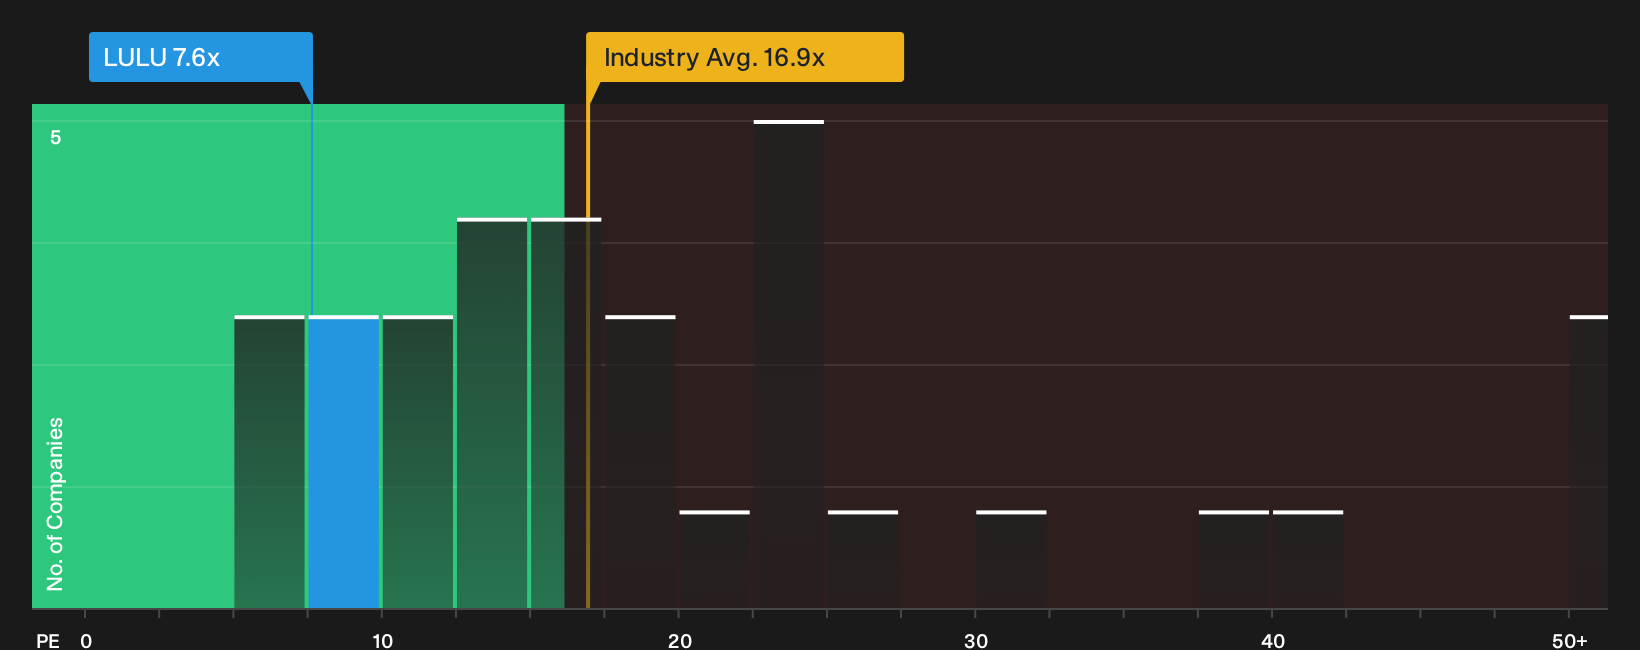
A different yardstick tells a cooler story. On a P/E of 7.6x, lululemon athletica trades at less than half the US Luxury industry on 16.9x and well below peers on 21x, while the fair ratio sits at 13x. That gap can be read as potential upside or a signal the market still expects more bad news. Which interpretation do you lean toward?
To see how that earnings multiple stacks up against the detailed assumptions behind one valuation framework, have a look at the See what the numbers say about this price — find out in our valuation breakdown..
Simply Wall St performs a discounted cash flow (DCF) on every stock in the world every day (check out lululemon athletica for example). We show the entire calculation in full. You can track the result in your watchlist or portfolio and be alerted when this changes, or use our stock screener to discover 33 high quality undervalued stocks. If you save a screener we even alert you when new companies match - so you never miss a potential opportunity.
Next Steps
Sentiment on lululemon athletica is mixed. Use this as your prompt to quickly review the facts and evaluate the trade off for yourself with 2 key rewards and 1 important warning sign
Looking for more investment ideas beyond lululemon athletica?
If lululemon athletica has you rethinking concentration risk, now is the moment to widen your opportunity set and line up your next few candidates.
- Target dependable cash flows by reviewing a 8 dividend fortresses that can help anchor portfolios when sentiment around consumer names like lululemon athletica turns choppy.
- Spot resilient businesses through a 32 resilient stocks with low risk scores that screens for companies with steadier fundamentals and potentially smoother return paths.
- Hunt for mispriced quality by scanning a 20 high quality undiscovered gems that highlights under-followed stocks before broader attention catches up.
This article by Simply Wall St is general in nature. We provide commentary based on historical data and analyst forecasts only using an unbiased methodology and our articles are not intended to be financial advice. It does not constitute a recommendation to buy or sell any stock, and does not take account of your objectives, or your financial situation. We aim to bring you long-term focused analysis driven by fundamental data. Note that our analysis may not factor in the latest price-sensitive company announcements or qualitative material. Simply Wall St has no position in any stocks mentioned.
Have feedback on this article? Concerned about the content? Get in touch with us directly. Alternatively, email editorial-team@simplywallst.com