


CTP’s Italian park launch and stock context
CTP (ENXTAM:CTPNV) has opened CTPark Castel San Giovanni in Northern Italy, a nearly 200,000 sqm logistics project that anchors its €1b, five year investment plan in the country.
The build includes a completed 52,000 sqm facility for an international logistics operator and a 113,000 sqm project for a luxury sector client, reinforcing CTP’s developer landlord model and long term focus on tailored, energy efficient industrial space.
CTP’s Italian expansion comes at a challenging time for the ticker, with the share price at €12.72 after a year-to-date share price return that is down 27.89% and a 1-year total shareholder return that is down 28.59%. The 3-year total shareholder return of 10.34% still reflects earlier strength and suggests that recent price weakness may relate more to changing risk perception than to the latest development news.
Scan how other real estate developers are positioning for logistics demand alongside CTP by reviewing our hand picked list of solid balance sheet and fundamentals (203 results).
CTP’s share price slide has reset expectations just as the Italian build out gathers pace. Is more of the opportunity now in front of you, or already reflected in today’s €12.72 level?
Price-to-earnings of 11.2x for CTP: Is it justified?
CTP changes hands at a P/E of 11.2x, which puts the €12.72 share price in a zone where the stock looks cheaper than the broader European real estate group but richer than its closest peer set.
The P/E multiple compares the current share price to earnings per share and gives a quick sense of how much investors are willing to pay for each euro of profit. For a logistics focused real estate owner and developer, that matters because earnings can swing with revaluations and financing costs, so the ratio can reflect more than just rent coming in the door.
CTP trades at a lower P/E than the wider European real estate industry average of 11.5x, which suggests the market is assigning a slightly lower price tag to each euro of earnings than it does for the sector overall. At the same time, the multiple is higher than the 8.8x peer average, which points to investors attaching a fuller valuation compared with more direct comparables, even with recent earnings volatility and the presence of one off items.
See what the numbers say about this price — find out in our valuation breakdown.
Result: Price-to-earnings of 11.2x (ABOUT RIGHT)
Still, pressure on CTP’s share price and reliance on continued tenant demand for its 13.8 million sqm portfolio could quickly test the current valuation story.
Find out about the key risks to this CTP narrative.
Another view on CTP’s value
The P/E workup paints CTP as roughly in the right zone, yet our DCF model points to a slightly different picture. On that framework, the shares at €12.72 sit about 7.5% below an estimated future cash flow value of €13.75. Which lens do you trust when the signals only just diverge?
Look into how the SWS DCF model arrives at its fair value.
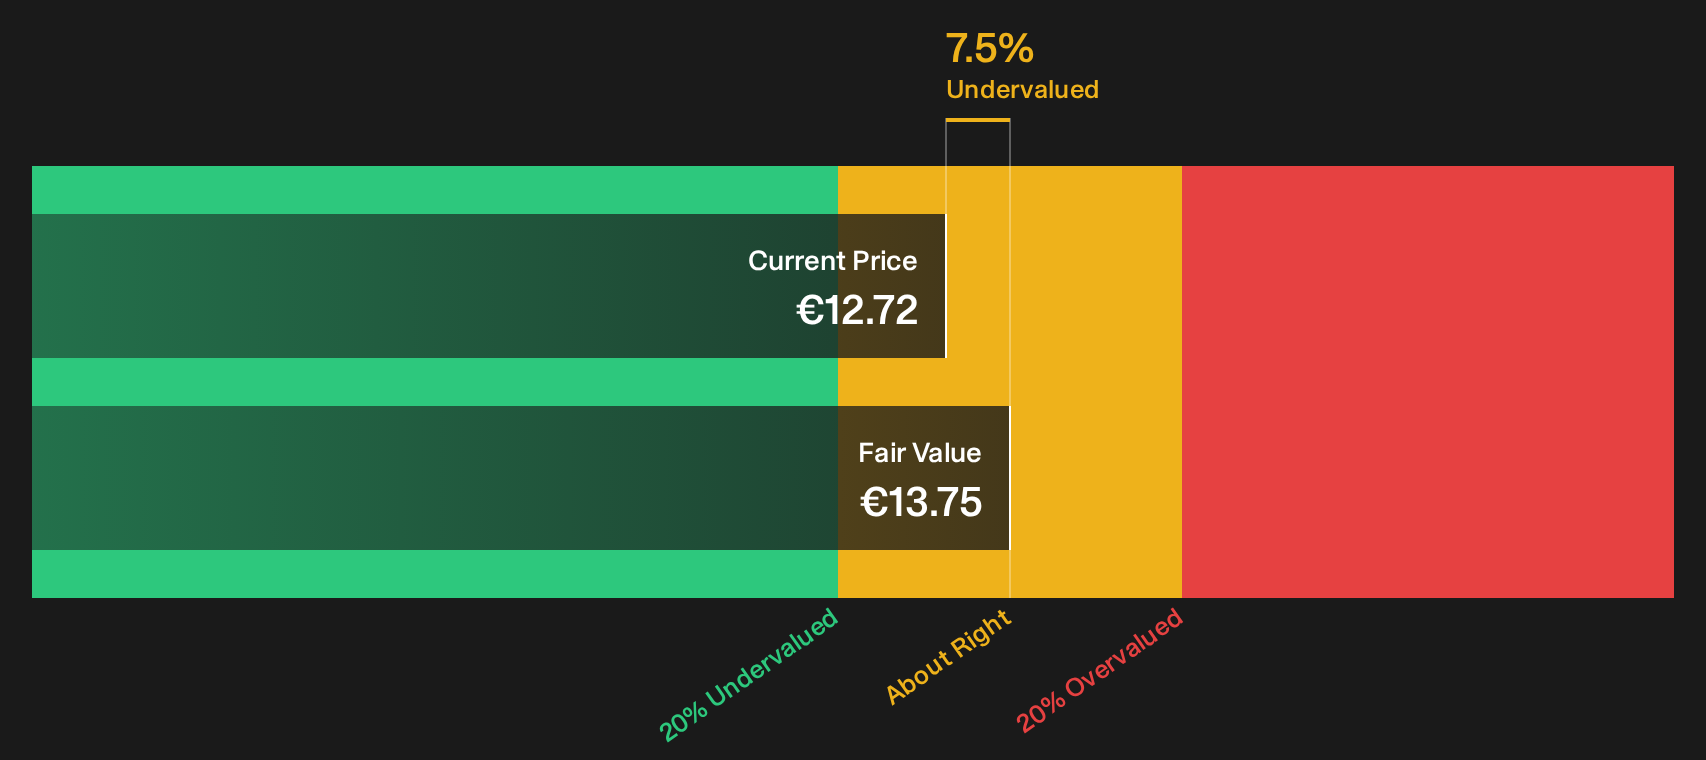
Simply Wall St performs a discounted cash flow (DCF) on every stock in the world every day (check out CTP for example). We show the entire calculation in full. You can track the result in your watchlist or portfolio and be alerted when this changes, or use our stock screener to discover 195 high quality undervalued stocks. If you save a screener we even alert you when new companies match - so you never miss a potential opportunity.
Next Steps
Mixed signals on CTP’s value story are one thing; your own judgment is another. Move quickly and weigh the 3 key rewards and 4 important warning signs.
Looking for more investment ideas beyond CTP?
Do not stop with one stock story. Line up a few quality candidates so you always have options when prices move faster than your decision making.
- Target dependable compounding potential by scanning a curated pool of companies that look mispriced on fundamentals using the 195 high quality undervalued stocks.
- Anchor your income plan by reviewing a focused set of higher yield payers that prioritise resilience with the 216 dividend fortresses.
- Stack your watchlist with businesses that pair sturdy finances with sensible operations through the 231 resilient stocks with low risk scores.
This article by Simply Wall St is general in nature. We provide commentary based on historical data and analyst forecasts only using an unbiased methodology and our articles are not intended to be financial advice. It does not constitute a recommendation to buy or sell any stock, and does not take account of your objectives, or your financial situation. We aim to bring you long-term focused analysis driven by fundamental data. Note that our analysis may not factor in the latest price-sensitive company announcements or qualitative material. Simply Wall St has no position in any stocks mentioned.
Have feedback on this article? Concerned about the content? Get in touch with us directly. Alternatively, email editorial-team@simplywallst.com