


Systena (TSE:2317) has drawn fresh investor attention after a period of earnings growth, combined with steady dividend payments and recurring enterprise contracts. This has put its digital transformation and cloud services model back under the spotlight.
Systena’s share price has slipped year to date with a decline of about 11.8%. However, a 7.8% 90-day share price return hints at improving momentum, while the 3-year total shareholder return of about 104% shows how powerful compounding dividends and price moves have been together.
Scan Systena alongside other solid balance sheet plays by checking the list of solid balance sheet and fundamentals (22 results), which filters for companies combining resilient finances with fundamental strength.
Systena has slipped this year yet delivered strong multi year total returns and steady dividends. Does that recent pullback leave the risk reward balance still tilting toward buyers when you look at the current valuation?
Price-to-Earnings of 14.2x: Is it justified?
Systena trades on a P/E of 14.2x, and that level lines up with a stock that screens as undervalued relative to both peers and its own fundamentals at the recent ¥454 close.
The P/E ratio links what you pay per share to the earnings that Systena generates, which matters a lot for a software-focused group that already has an established profit base. For a reader, it is basically a shorthand for how many years of current earnings the market is willing to pay upfront.
Earnings have been expanding, with profit growth of 23.1% over the past year and an average of 15.9% per year across five years, and margins have moved from 10.7% to 11.9%. Set against that backdrop, a 14.2x P/E that is below the estimated fair P/E of 18x suggests the market could be pricing Systena more cautiously than its track record and high return on equity of 28.4% might justify.
The comparison is stark against both direct peers and the broader JP Software group. Systena trades at 14.2x earnings while peer companies average 23.8x and the sector as a whole trades around 18.5x, which points to a clear valuation gap that investors will notice if sentiment turns.
Explore the SWS fair ratio for Systena.
Result: Price-to-Earnings of 14.2x (UNDERVALUED)
Still, the share price decline of 11.8% year to date and a 1-year total return that is down 3.4% show that sentiment can shift against Systena.
Find out about the key risks to this Systena narrative.
Another View: Systena’s Value Through Cash Flows
Price based ratios only tell you what people are willing to pay today. The SWS DCF model asks a different question: What are Systena’s future cash flows worth in today’s money?
On that score, the model points to a value of ¥676.72 per share versus the current ¥454 level. That implies Systena trades at about a 32.9% discount, so investors weighing the lower P/E also have a cash flow based margin to think about. If the cash flows materialise as expected, is the gap wide enough for you?
Look into how the SWS DCF model arrives at its fair value.
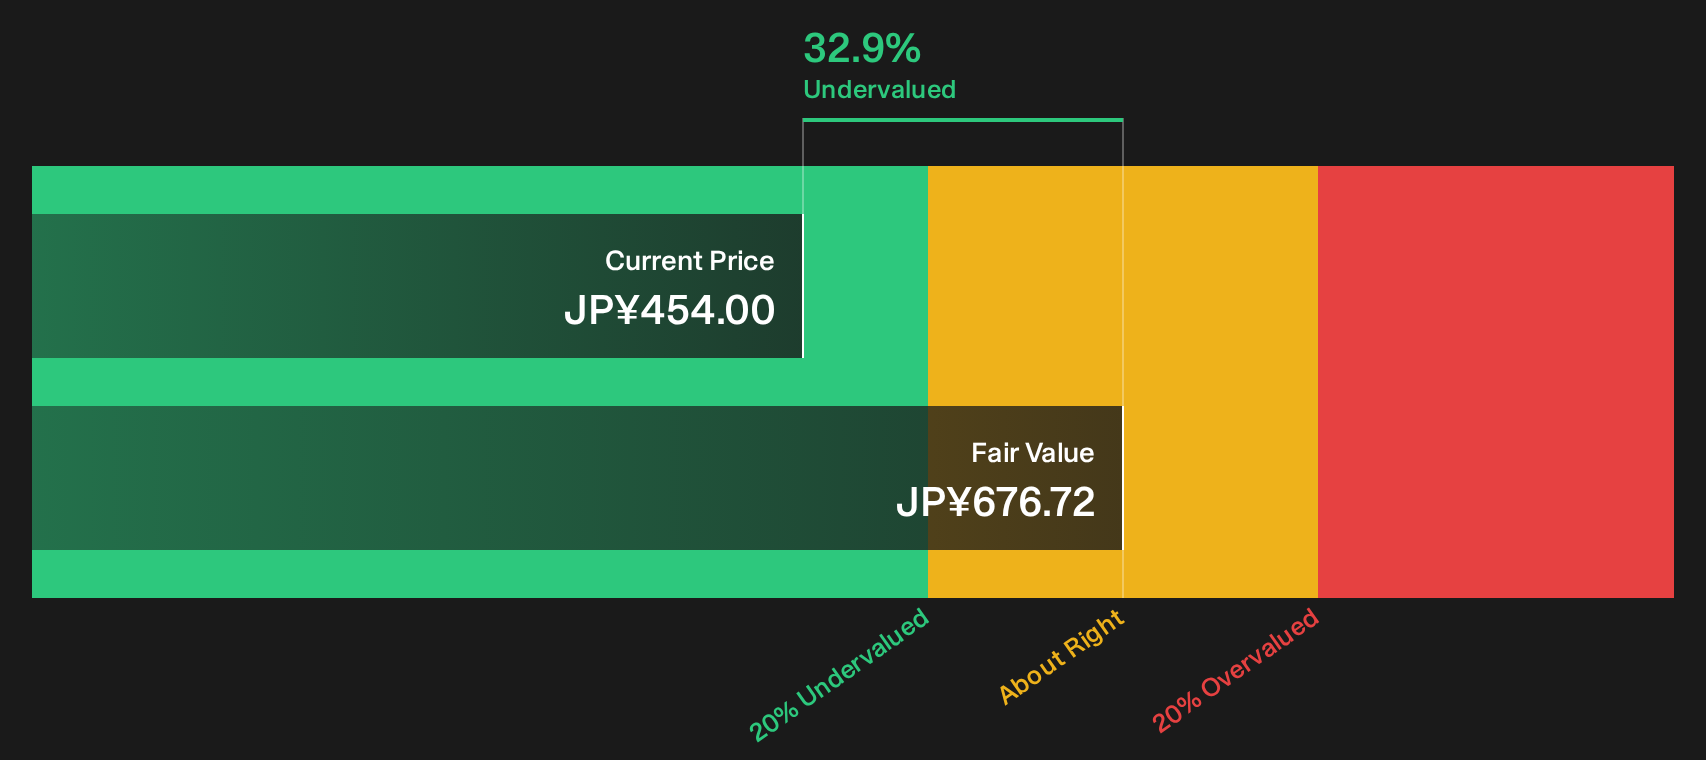
Simply Wall St performs a discounted cash flow (DCF) on every stock in the world every day (check out Systena for example). We show the entire calculation in full. You can track the result in your watchlist or portfolio and be alerted when this changes, or use our stock screener to discover 13 high quality undervalued stocks. If you save a screener we even alert you when new companies match - so you never miss a potential opportunity.
Next Steps
If the tone of this Systena review feels cautiously optimistic, treat it as a prompt to check the numbers yourself and move quickly to your own view. To see what positives others are focusing on, start with the 5 key rewards.
Looking for more Systena investment ideas?
If Systena has sharpened your focus on quality and price, do not stop here. Broader ideas often appear first in a good screener.
- Target value opportunities that combine quality and a price that might still leave room for upside by scanning the 13 high quality undervalued stocks.
- Build an income focused watchlist by reviewing the 29 dividend fortresses, which highlights companies with higher yields and the potential for sturdier cash distributions.
- Prioritise resilience and support a more defensive approach by checking the 22 resilient stocks with low risk scores, where firms with stronger risk scores come to the surface first.
This article by Simply Wall St is general in nature. We provide commentary based on historical data and analyst forecasts only using an unbiased methodology and our articles are not intended to be financial advice. It does not constitute a recommendation to buy or sell any stock, and does not take account of your objectives, or your financial situation. We aim to bring you long-term focused analysis driven by fundamental data. Note that our analysis may not factor in the latest price-sensitive company announcements or qualitative material. Simply Wall St has no position in any stocks mentioned.
Have feedback on this article? Concerned about the content? Get in touch with us directly. Alternatively, email editorial-team@simplywallst.com