


Yoshinoya Holdings (TSE:9861) just raised its full year earnings outlook and guided for a higher year end dividend, a combination that puts capital allocation and profit expectations firmly in focus for shareholders.
Recent trading has picked up meaningfully, with Yoshinoya Holdings posting a 3.30% 1 day share price return and a 17.97% 30 day share price return, while long term investors have seen a 104.95% 5 year total shareholder return.
Scan for other consumer names showing similar earnings momentum and dividend signals by reviewing our curated list of 73 high quality undiscovered gems alongside Yoshinoya Holdings today.
Bulls point to Yoshinoya Holdings lifting guidance and its dividend as proof the recent share price strength has support. Skeptics flag the rich run up and analyst target gap. Which story do the numbers back?
Price-to-Earnings of 47.2x: Is it justified?
On current numbers, Yoshinoya Holdings trades on a P/E of 47.2x, which is a rich tag for a stock that last closed at ¥4,293 and already reflects strong recent share price gains.
The P/E ratio compares what investors are paying today for each unit of earnings. It is especially closely watched for consumer and hospitality groups where profit cycles can be sensitive to traffic and input costs. A higher multiple usually signals that the market is willing to pay up for earnings quality, resilience or expected growth in profits.
For Yoshinoya Holdings, that 47.2x P/E sits well above the estimated fair P/E of 22.9x. This is a level the market could move towards if sentiment cools or if earnings delivery falls short of expectations. The current ratio is also more than double the JP Hospitality industry average of 21.9x, a strong indication that investors are assigning a premium far beyond the sector norm.
Explore the SWS fair ratio for Yoshinoya Holdings.
Result: Price-to-Earnings of 47.2x (OVERVALUED)
Still, Yoshinoya Holdings faces a sharp gap to the ¥2,800 analyst target, and any disappointment on earnings or dividends could unwind recent momentum.
Find out about the key risks to this Yoshinoya Holdings narrative.
Another View: What The DCF Says About Yoshinoya Holdings
A second lens tells a slightly different story. Yoshinoya Holdings trades at ¥4,293, while our DCF model points to a future cash flow value of ¥3,728.29. That implies the shares are priced above this estimate, which raises a simple question: Is the recent enthusiasm getting ahead of the cash flows?
Look into how the SWS DCF model arrives at its fair value.
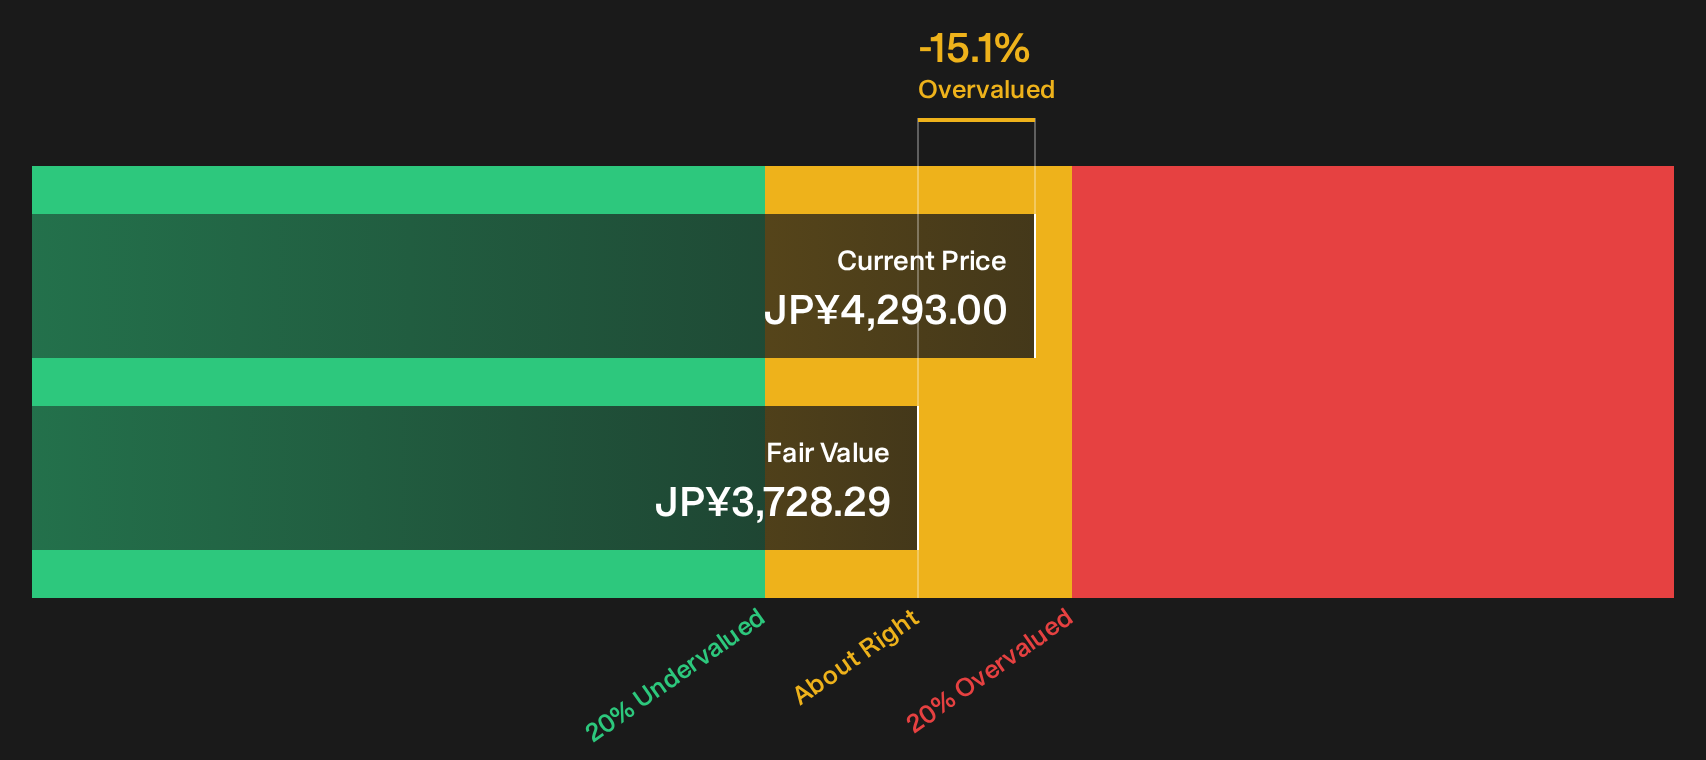
Simply Wall St performs a discounted cash flow (DCF) on every stock in the world every day (check out Yoshinoya Holdings for example). We show the entire calculation in full. You can track the result in your watchlist or portfolio and be alerted when this changes, or use our stock screener to discover 13 high quality undervalued stocks. If you save a screener we even alert you when new companies match - so you never miss a potential opportunity.
Next Steps
Mixed signals around Yoshinoya Holdings can make the story feel unsettled. This is exactly why you should go back to the numbers yourself and move before opinions harden. To see what is driving optimism around at least one key upside factor, review the 2 key rewards
Looking for more investment ideas beyond Yoshinoya Holdings?
If Yoshinoya Holdings has you thinking harder about valuation and dividends, do not stop there. Broaden your watchlist now so you are not reacting after the best setups have already moved.
- Target resilience first and stress test your capital against shocks with a basket of 22 resilient stocks with low risk scores that already clear strict risk filters.
- Prioritize quality at a fair tag and work through a focused group of 13 high quality undervalued stocks that pair fundamentals with pricing that still looks reasonable.
- Tighten capital discipline and concentrate on balance sheet strength by scanning a curated list of solid balance sheet and fundamentals (22 results) before the rest of the market catches on.
This article by Simply Wall St is general in nature. We provide commentary based on historical data and analyst forecasts only using an unbiased methodology and our articles are not intended to be financial advice. It does not constitute a recommendation to buy or sell any stock, and does not take account of your objectives, or your financial situation. We aim to bring you long-term focused analysis driven by fundamental data. Note that our analysis may not factor in the latest price-sensitive company announcements or qualitative material. Simply Wall St has no position in any stocks mentioned.
Have feedback on this article? Concerned about the content? Get in touch with us directly. Alternatively, email editorial-team@simplywallst.com