


Hokkaido Electric Power Company (TSE:9509) moved back into focus after management set construction costs for the Tomari Power Station seawall at ¥125.5b and confirmed an August 2027 completion target for this safety project.
Against this safety update, Hokkaido Electric Power Company’s recent trading tells a mixed story, with the 90 day share price return up 7.42% while the 1 year total shareholder return is down 1.84% following a much stronger 3 year total shareholder return of 85.41%.
Benchmark Hokkaido Electric Power Company's safety focused nuclear investment against peers by scanning utilities exposed to grid and nuclear infrastructure through the curated 42 power grid technology and infrastructure stocks
Given the seawall cost now fixed at ¥125.5b and Hokkaido Electric Power Company shares up over the past quarter but softer over one year, does the current valuation still leave enough reward for the safety and regulatory risk on the table?
Preferred P/E of 8.4x: Is it justified?
Hokkaido Electric Power Company closed at ¥1,093, which equates to a P/E of 8.4x. That sits above its direct peer average of 7.4x, yet below both the wider JP market on 14x and an estimated fair P/E of 12.8x.
The P/E ratio links what you pay today to the earnings the utility is currently generating. It is a simple way to see how much investors are willing to spend for each yen of profit. For a regulated electricity provider with relatively stable demand and heavy capital requirements, this measure often frames how the market weighs earnings power against balance sheet strain and regulatory constraints.
Hokkaido Electric Power Company trades richer than close peers on this P/E basis, which suggests investors are paying a premium relative to similar utilities. However, the same 8.4x figure is well below the Asian Electric Utilities industry average of 14.1x and also below the 12.8x fair P/E level that regression analysis identifies as a potential reference point for the market.
Explore the SWS fair ratio for Hokkaido Electric Power Company.
Result: Price-to-earnings of 8.4x (ABOUT RIGHT)
Still, the thesis around Hokkaido Electric Power Company can be knocked off course if nuclear regulatory hurdles tighten further or if large capital projects strain cash generation.
Find out about the key risks to this Hokkaido Electric Power Company narrative.
Another view on Hokkaido Electric Power Company's value
There is a twist when you compare that 8.4x P/E to our DCF work. The SWS DCF model points to a value of ¥1,013.93 per share, which is below the current ¥1,093 price. That framing suggests the shares screen as slightly overvalued on a cash flow basis. So which lens should carry more weight for you?
Look into how the SWS DCF model arrives at its fair value.
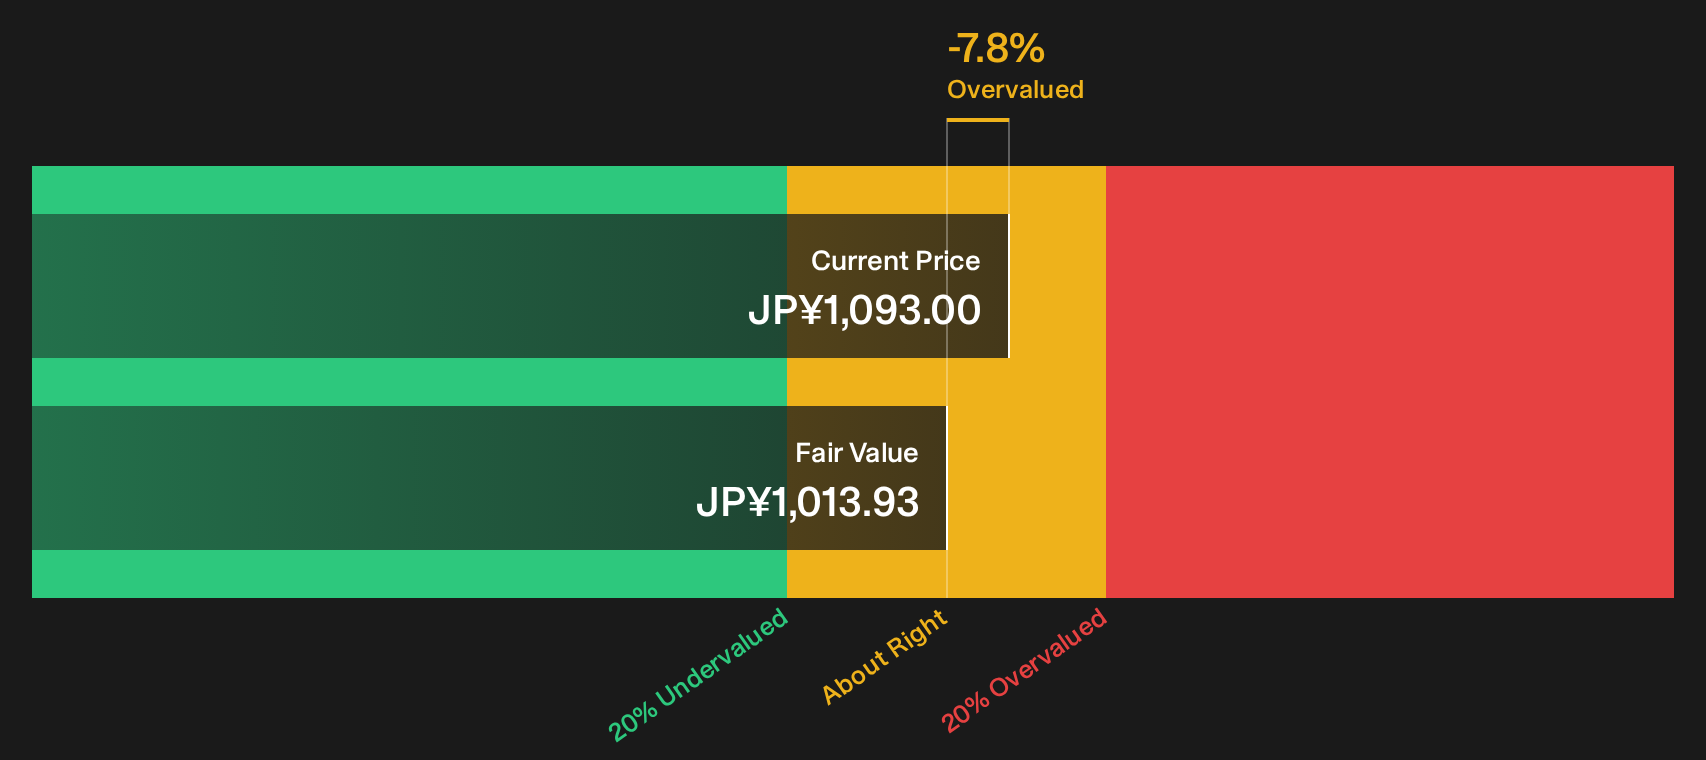
Simply Wall St performs a discounted cash flow (DCF) on every stock in the world every day (check out Hokkaido Electric Power Company for example). We show the entire calculation in full. You can track the result in your watchlist or portfolio and be alerted when this changes, or use our stock screener to discover 13 high quality undervalued stocks. If you save a screener we even alert you when new companies match - so you never miss a potential opportunity.
Next Steps
Mixed signals on Hokkaido Electric Power Company valuation and risk can feel hard to reconcile. Move quickly, review the data yourself, and stress test both the risk and upside case through the 2 key rewards and 3 important warning signs
Looking for more investment ideas beyond Hokkaido Electric Power Company?
If Hokkaido Electric Power Company has sharpened your focus on risk and reward, you may want to broaden your watchlist with fresh ideas that match your own investing style.
- Target potential mispricings by scanning a focused set of high quality opportunities through the 13 high quality undervalued stocks.
- Prioritise resilience and capital strength by screening companies with robust finances using the list of solid balance sheet and fundamentals (22 results).
- Hunt for underfollowed opportunities by zeroing in on fundamentally strong outliers through the 73 high quality undiscovered gems.
This article by Simply Wall St is general in nature. We provide commentary based on historical data and analyst forecasts only using an unbiased methodology and our articles are not intended to be financial advice. It does not constitute a recommendation to buy or sell any stock, and does not take account of your objectives, or your financial situation. We aim to bring you long-term focused analysis driven by fundamental data. Note that our analysis may not factor in the latest price-sensitive company announcements or qualitative material. Simply Wall St has no position in any stocks mentioned.
Have feedback on this article? Concerned about the content? Get in touch with us directly. Alternatively, email editorial-team@simplywallst.com