


In October 2026, global markets are navigating a landscape marked by AI spending concerns and inflation pressures, with major U.S. stock indexes experiencing a shift from growth to value-oriented segments. Amidst these conditions, identifying undervalued stocks can offer opportunities for investors seeking to capitalize on market rotations and defensive strategies.
Top 10 Undervalued Stocks Based On Cash Flows
| Name | Current Price | Fair Value (Est) | Discount (Est) |
| Valmet Oyj (HLSE:VALMT) | €27.30 | €53.75 | 49.2% |
| Riken Technos (TSE:4220) | ¥2426.00 | ¥4777.59 | 49.2% |
| P.S.P. Specialties (SET:PSP) | THB7.40 | THB14.57 | 49.2% |
| PAL GROUP Holdings (TSE:2726) | ¥1469.00 | ¥2911.94 | 49.6% |
| Orthex Oyj (HLSE:ORTHEX) | €4.39 | €8.71 | 49.6% |
| Lindab International (OM:LIAB) | SEK127.80 | SEK252.53 | 49.4% |
| Koninklijke BAM Groep (ENXTAM:BAMNB) | €11.55 | €23.06 | 49.9% |
| Inner Mongolia ERDOS ResourcesLtd (SHSE:600295) | CN¥14.32 | CN¥28.31 | 49.4% |
| Eni (BIT:ENI) | €26.135 | €51.48 | 49.2% |
| China Resources Sanjiu Medical & Pharmaceutical (SZSE:000999) | CN¥26.26 | CN¥52.47 | 50% |
Let's dive into some prime choices out of the screener.
Orascom Construction (ADX:ORAS)
Overview: Orascom Construction PLC, with a market cap of AED6.67 billion, operates as an engineering and construction contractor focusing on infrastructure, complex industrial, and high-end commercial projects across the United States, the Middle East, Africa, and Central Asia.
Operations: The company's revenue is derived from its operations in the USA, contributing $2.88 billion, and the MENA region, generating $3.20 billion.
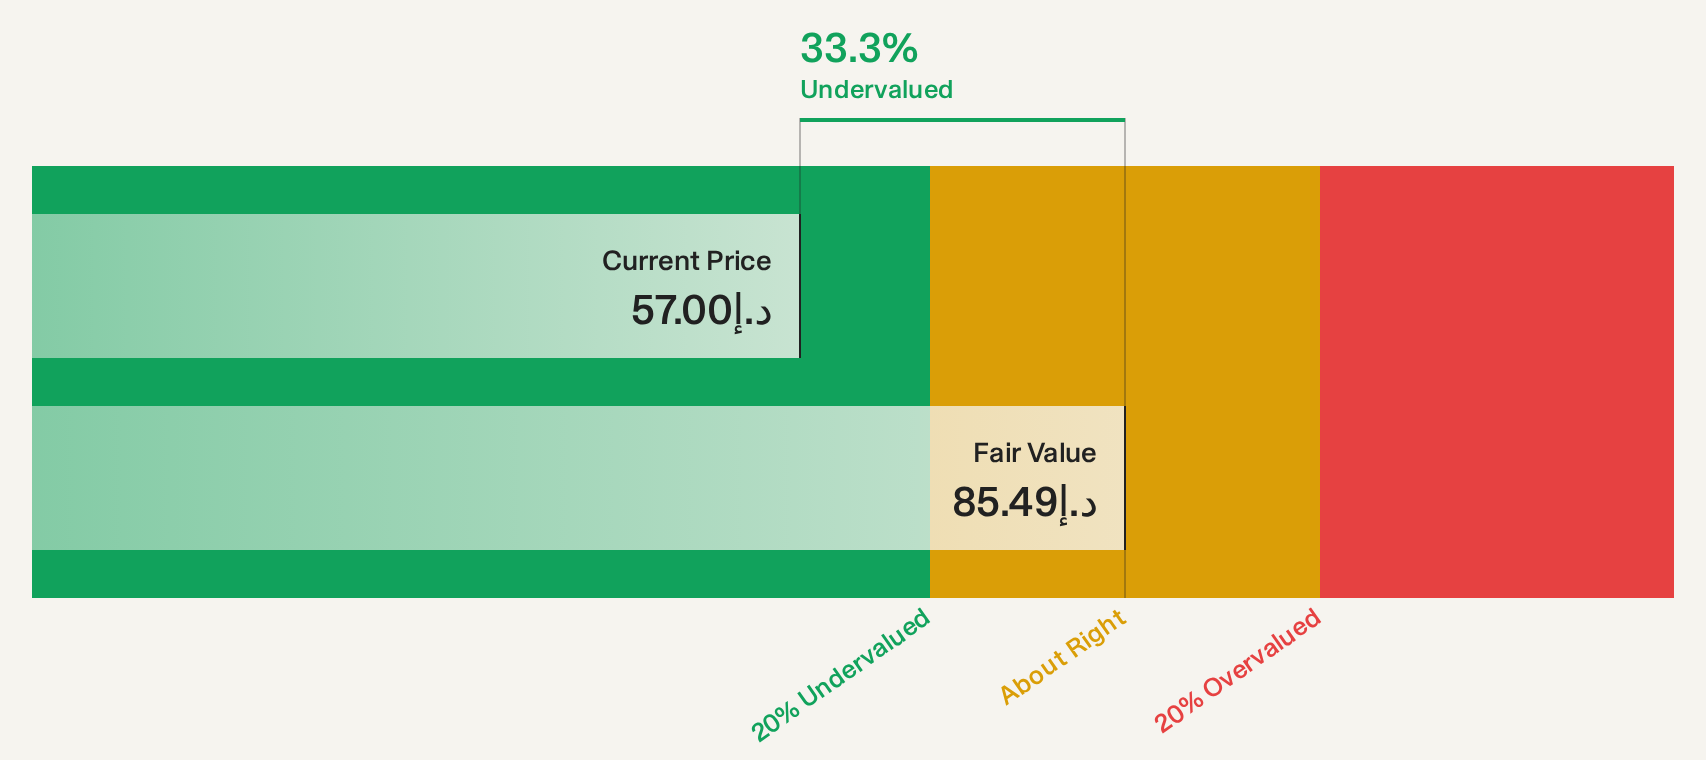
Estimated Discount To Fair Value: 31%
Orascom Construction is trading at AED59.3, significantly below its estimated future cash flow value of AED85.94, indicating it may be undervalued based on cash flows. Recent earnings show growth with second-quarter sales rising to US$1.51 billion from US$1.11 billion a year ago and net income increasing to US$61.9 million from US$57.6 million. Despite slower forecasted revenue and earnings growth compared to the AE market, its current valuation presents potential value relative to peers and industry standards.
- Our comprehensive growth report raises the possibility that Orascom Construction is poised for substantial financial growth.
- Click here and access our complete balance sheet health report to understand the dynamics of Orascom Construction.
Shandong Weigao Blood Purification Products (SHSE:603014)
Overview: Shandong Weigao Blood Purification Products Co., Ltd. operates in the healthcare sector, focusing on the production of blood purification products, with a market cap of CN¥12.33 billion.
Operations: The company generates revenue primarily from its Medical Products segment, which amounts to CN¥3.76 billion.
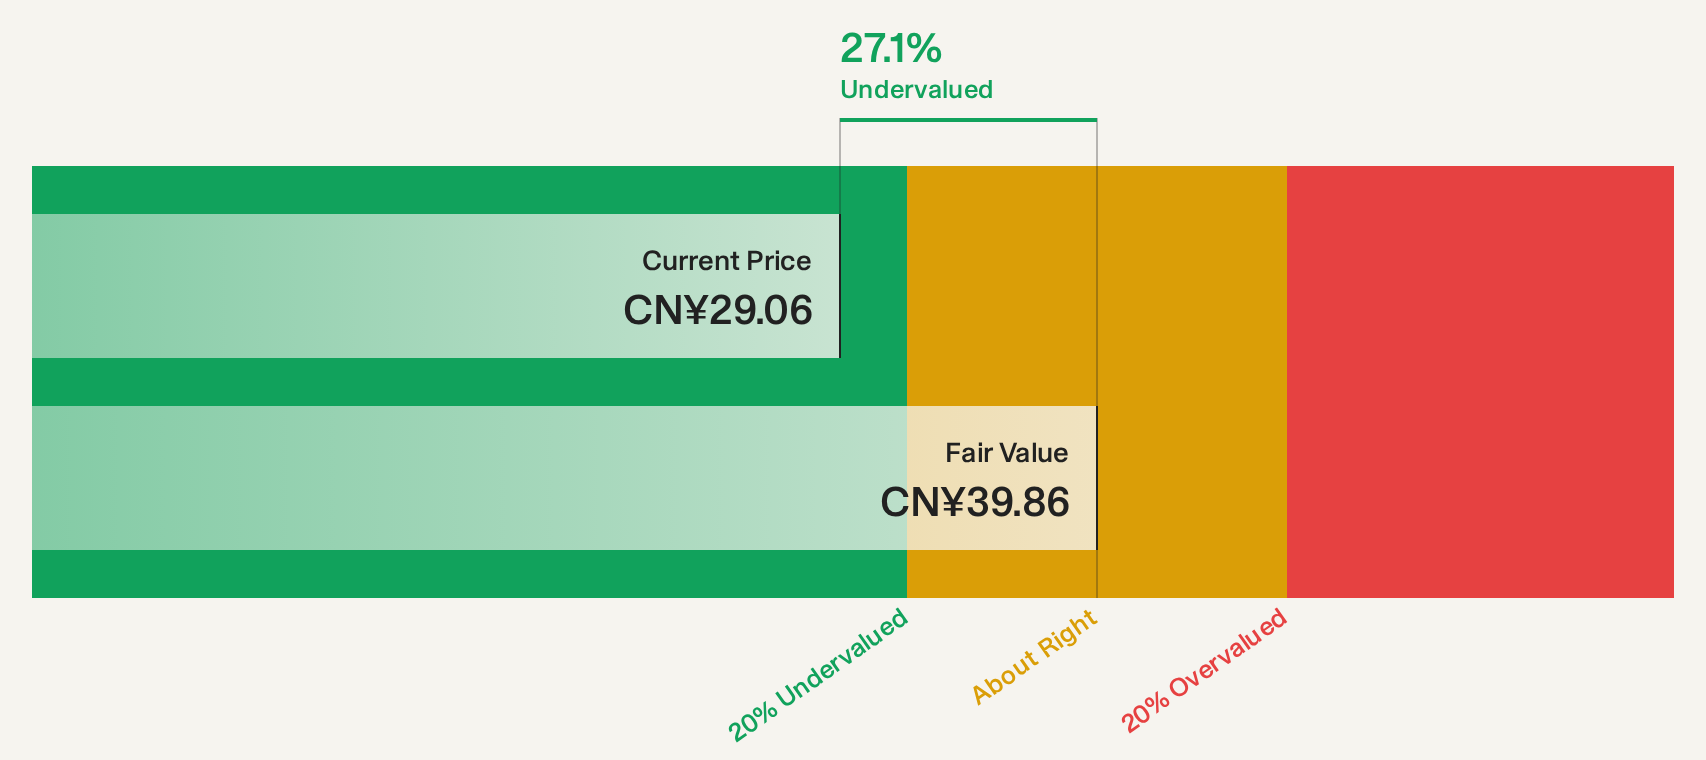
Estimated Discount To Fair Value: 26%
Shandong Weigao Blood Purification Products is trading at CN¥29.46, below its estimated future cash flow value of CN¥39.82, highlighting potential undervaluation based on cash flows. Despite modest earnings growth of 4.7% and revenue slightly increasing to CNY 1,758.24 million in H1 2026, it remains a good relative value compared to peers and industry standards. However, its forecasted revenue and earnings growth lag behind the broader Chinese market expectations.
- Our growth report here indicates Shandong Weigao Blood Purification Products may be poised for an improving outlook.
- Click here to discover the nuances of Shandong Weigao Blood Purification Products with our detailed financial health report.
Zhejiang Shuanghuan DrivelineLtd (SZSE:002472)
Overview: Zhejiang Shuanghuan Driveline Co., Ltd. designs, researches, develops, and manufactures mechanical transmission gears and related parts for both domestic and international markets with a market capitalization of CN¥30.65 billion.
Operations: The company generates revenue primarily from its General Machinery Manufacturing segment, which amounts to CN¥9.44 billion.
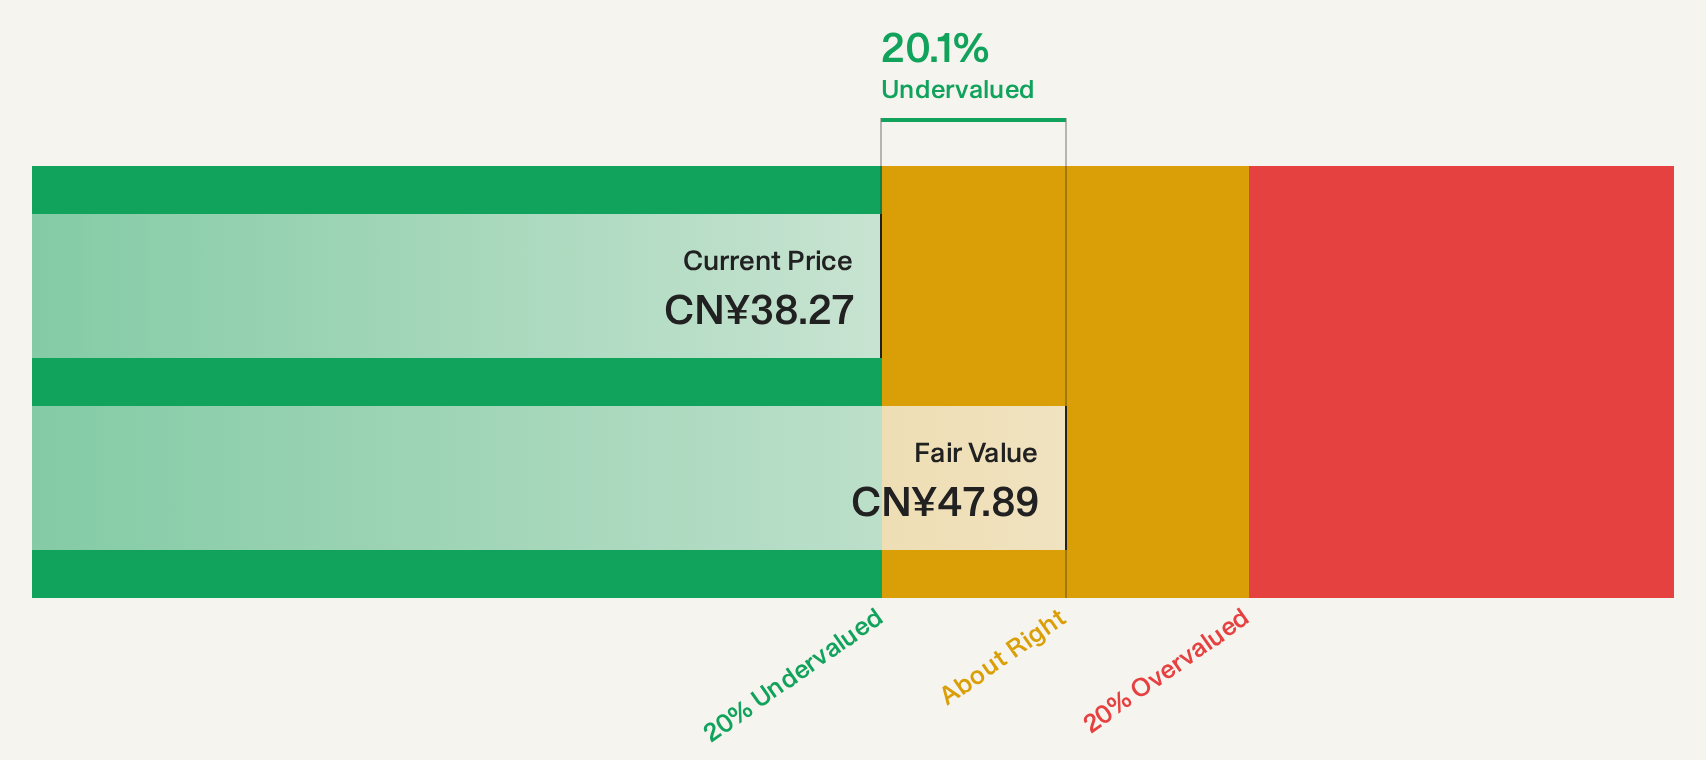
Estimated Discount To Fair Value: 24.1%
Zhejiang Shuanghuan Driveline Ltd. is trading at CN¥36.06, under its projected future cash flow value of CN¥47.53, suggesting potential undervaluation based on cash flows. Recent earnings showed a modest increase to CNY 586.65 million for H1 2026, with revenue rising to CNY 4,558.95 million from the previous year. Although earnings are forecasted to grow annually by 14.63%, this lags behind broader market expectations in China and dividend sustainability remains a concern due to limited free cash flow coverage.
- According our earnings growth report, there's an indication that Zhejiang Shuanghuan DrivelineLtd might be ready to expand.
- Get an in-depth perspective on Zhejiang Shuanghuan DrivelineLtd's balance sheet by reading our health report here.
Next Steps
- Take a closer look at our Undervalued Global Stocks Based On Cash Flows list of 258 companies by clicking here.
- Are you invested in these stocks already? Keep abreast of every twist and turn by setting up a portfolio with Simply Wall St, where we make it simple for investors like you to stay informed and proactive.
- Take control of your financial future using Simply Wall St, offering free, in-depth knowledge of international markets to every investor.
Curious About Other Options?
- Explore high-performing small cap companies that haven't yet garnered significant analyst attention.
- Diversify your portfolio with solid dividend payers offering reliable income streams to weather potential market turbulence.
- Fuel your portfolio with companies showing strong growth potential, backed by optimistic outlooks both from analysts and management.
This article by Simply Wall St is general in nature. We provide commentary based on historical data and analyst forecasts only using an unbiased methodology and our articles are not intended to be financial advice. It does not constitute a recommendation to buy or sell any stock, and does not take account of your objectives, or your financial situation. We aim to bring you long-term focused analysis driven by fundamental data. Note that our analysis may not factor in the latest price-sensitive company announcements or qualitative material. Simply Wall St has no position in any stocks mentioned.
Have feedback on this article? Concerned about the content? Get in touch with us directly. Alternatively, email editorial-team@simplywallst.com