


First American Financial (FAF) heads into its earnings release this Wednesday after the close, with analysts projecting 6.3% year on year revenue growth and a slower pace than last year’s exceptionally strong quarter.
At a share price of US$64.82, First American Financial has seen short term momentum pick up, with a 7 day share price return of 6.38% following a weaker 30 day move and a 90 day period that declined 9.53%.
Scan how First American Financial’s pre earnings momentum compares with other insurance and financials stocks that screen strongly on quality and valuation using our curated 35 high quality undervalued stocks.
The share price recovery ahead of earnings puts First American Financial about US$20 below the average analyst target, while intrinsic value estimates suggest a lower figure. Where does fair value fall within that range?
Most Popular Narrative: 24% Undervalued
On the current narrative, First American Financial’s fair value of $85 sits well above Monday’s $64.82 close. This puts the spotlight on whether the business can convert its existing momentum in margins and cash generation into durable returns for shareholders.
Capital allocation that keeps overall technology spend relatively flat while large AI and platform programs are built, combined with rising dividends and ongoing share repurchases funded by growing free cash flow, points to a multiyear opportunity for First American Financial to translate operating efficiency gains into higher per share earnings.
See why 3 investors see First American Financial as 24% undervalued.
Result: Fair Value of $85 (UNDERVALUED)
Still, this fair value story can unravel if weak residential purchase and refinance activity persists, or if FHFA refinance title waivers expand and erode First American Financial’s volumes.
Find out about the key risks to this First American Financial narrative.
Another View On First American Financial’s Value
The first narrative leans on a fair value of $85, yet our DCF model tells a very different story. On that approach, First American Financial’s future cash flows point to a value of just $8.10, which would imply the shares trade well above intrinsic value. Which story do you think fits the risks better?
For investors who want to see how this cash flow based view is constructed step by step, it helps to look directly at the full model output, assumptions and sensitivity work in one place, then weigh it against the earnings based fair value already discussed, using the Look into how the SWS DCF model arrives at its fair value.
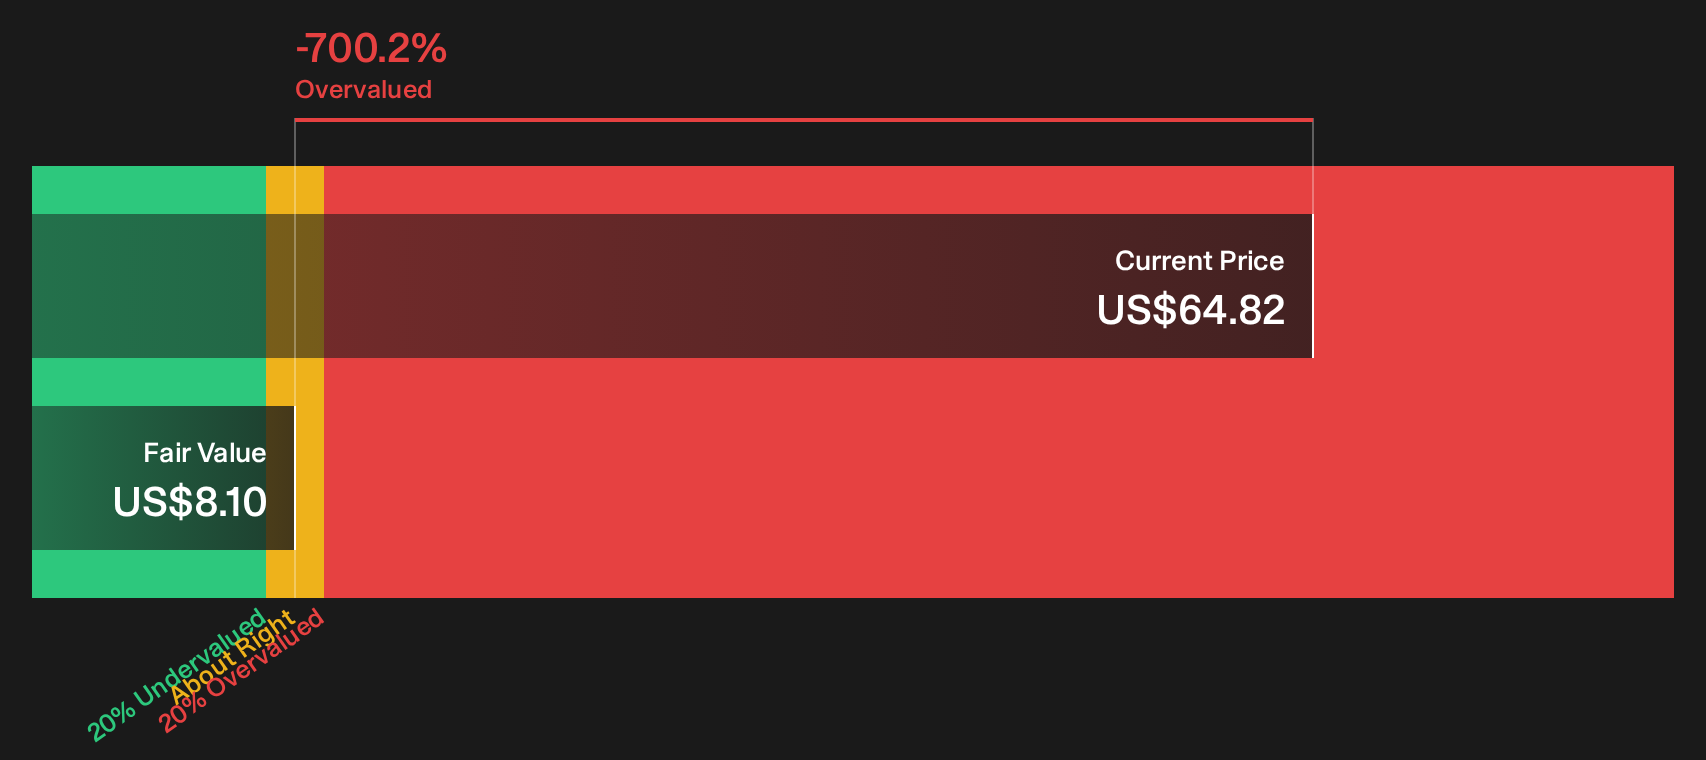
Simply Wall St performs a discounted cash flow (DCF) on every stock in the world every day (check out First American Financial for example). We show the entire calculation in full. You can track the result in your watchlist or portfolio and be alerted when this changes, or use our stock screener to discover 35 high quality undervalued stocks. If you save a screener we even alert you when new companies match - so you never miss a potential opportunity.
Next Steps
Mixed signals on First American Financial’s value story. Act while sentiment is still split and check the 5 key rewards and 1 important warning sign for the full context.
Looking for more investment ideas beyond First American Financial?
If you stop with First American Financial, you could miss out on other quality opportunities. Take a few minutes to scan wider and sharpen your watchlist.
- Target stronger return potential by reviewing resilient businesses with lower perceived risk using the 32 resilient stocks with low risk scores.
- Zero in on companies that pair reasonable pricing with solid fundamentals through the 35 high quality undervalued stocks.
- Balance income and stability by sourcing payout focused opportunities in the 8 dividend fortresses.
Have feedback on this article? Concerned about the content? Get in touch with us directly. Alternatively, email editorial-team@simplywallst.com