


- Strategy Inc (NasdaqGS:MSTR) is close to triggering a golden cross on its share price, with the 50-day moving average approaching the 200-day level.
- The looming crossover follows a recent golden cross signal in Bitcoin, which is Strategy Inc's primary treasury holding.
- Traders are watching the alignment of Strategy Inc and Bitcoin technical trends as a potential catalyst for fresh momentum-focused interest.
- The pending golden cross on Strategy Inc's chart is important, but it should not dominate every investment decision. Check out 1 other big win that Strategy investors should know about.
For a wider view on how crypto-related trades are evolving beyond Strategy Inc, compare this signal with other blockchain and digital asset plays through 20 cryptocurrency and blockchain stocks.
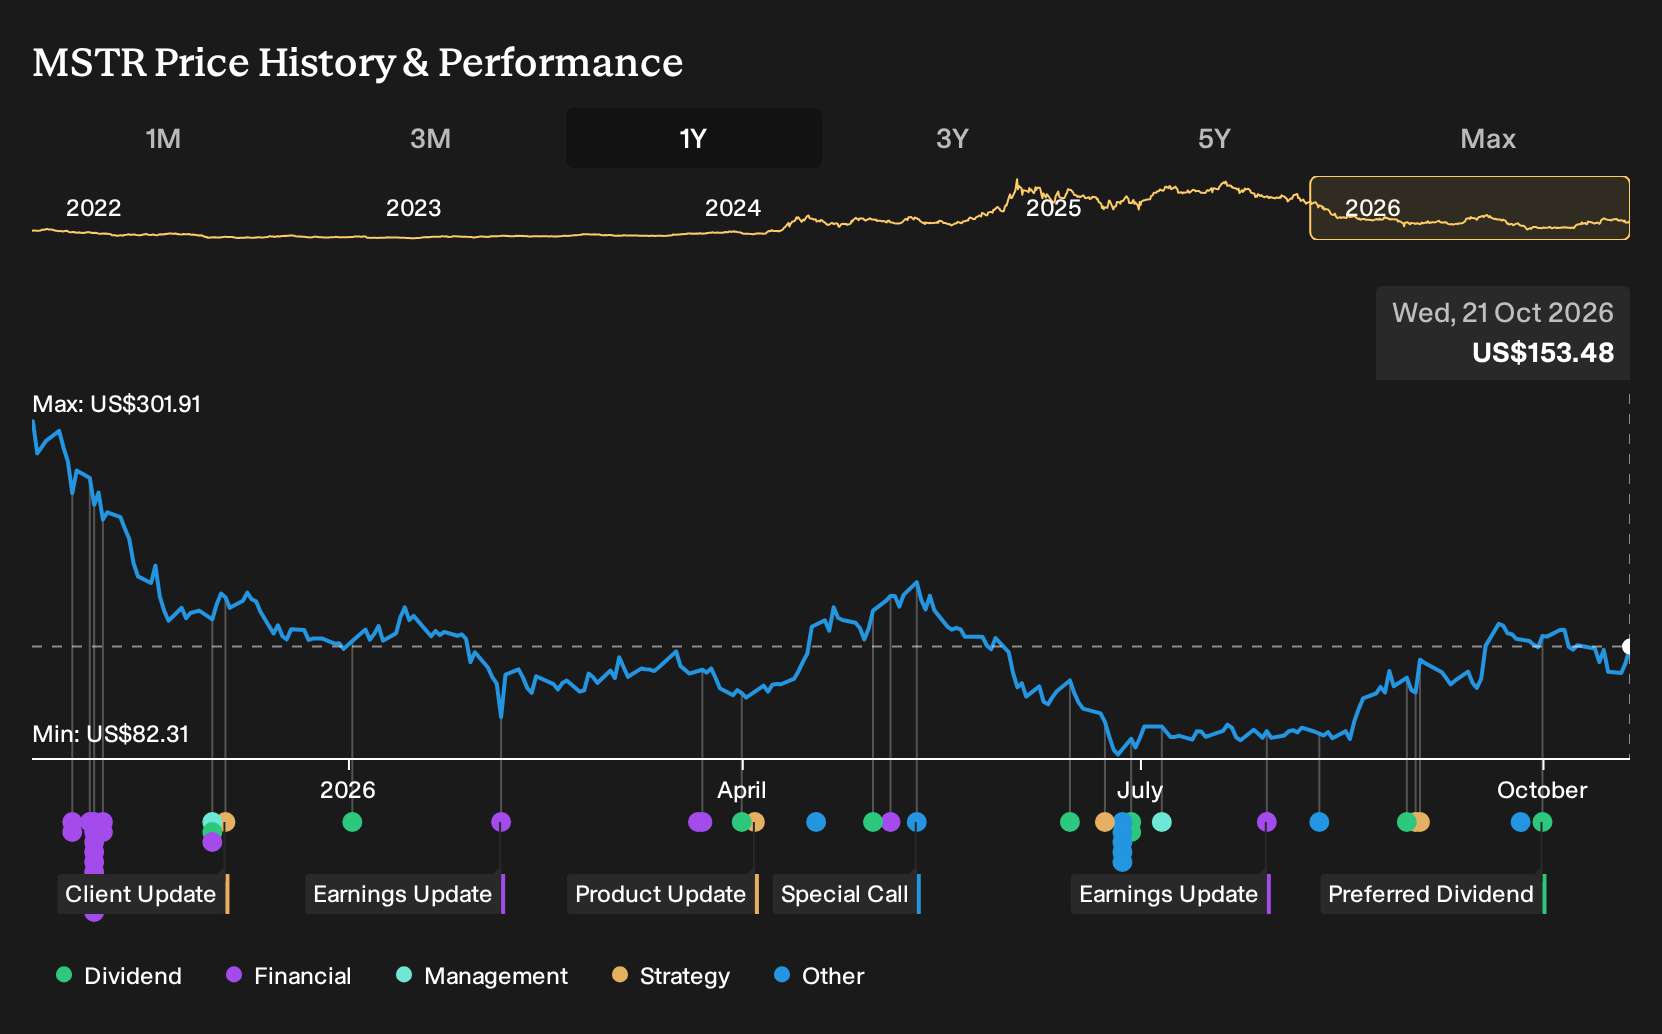
Strategy operates as a bitcoin treasury company within the software sector, so many investors treat moves in its technical trend as a way to express a view on large scale corporate bitcoin exposure rather than on traditional software fundamentals.
See which insiders are buying and selling Strategy following this latest news.
What does a golden cross on Strategy Inc actually signal?
A golden cross on Strategy Inc means its 50 day moving average is on the verge of crossing above its 200 day moving average, which traders often read as a shift toward a more positive trend. For a bitcoin treasury focused stock, that aligns the chart with the recent bullish signal already seen in Bitcoin itself.
How does this fit with Strategy's broader risk and reward profile?
The potential crossover lands on top of a mixed picture that includes volatile trading, recent shareholder dilution and forecasts that point to projected earnings growth of 123.66% per year. Chart strength in this context is often interpreted as reinforcing the idea of higher upside potential, but it also sits against existing funding and volatility pressures already flagged around Strategy.
What is the clearest early test of whether this signal has real backing?
The clearest checkpoint is how Strategy Inc trades in the weeks after the 50 day average actually crosses the 200 day level, especially relative to Bitcoin's own price action. If the share price holds above both averages with trading volumes staying elevated rather than fading quickly, that would indicate more committed interest behind the signal.
The underused clue in Strategy Inc forecasts that many holders scroll past
Most people stop at the chart. Yet the longer term analyst projections for where Strategy Inc could be a few years from now point to a destination that looks very different to the picture in this article. See where analysts expect Strategy to be in a few years.
Have feedback on this article? Concerned about the content? Get in touch with us directly. Alternatively, email editorial-team@simplywallst.com