


In recent weeks, global markets have experienced significant volatility, driven by concerns over AI-related investments and inflationary pressures. As investors shift focus towards value-oriented segments amidst these uncertainties, opportunities may arise in stocks that are potentially undervalued. Identifying such stocks often involves looking for companies with strong fundamentals that are temporarily overlooked due to broader market trends or sector-specific challenges.
Top 10 Undervalued Stocks Based On Cash Flows
| Name | Current Price | Fair Value (Est) | Discount (Est) |
| Valmet Oyj (HLSE:VALMT) | €26.90 | €53.61 | 49.8% |
| Nissui (TSE:1332) | ¥1097.50 | ¥2164.45 | 49.3% |
| Kumagai GumiLtd (TSE:1861) | ¥1211.00 | ¥2421.52 | 50% |
| Kona ILtd (KOSDAQ:A052400) | ₩34700.00 | ₩69320.44 | 49.9% |
| Industrias Peñoles. de (BMV:PE&OLES *) | MX$887.41 | MX$1759.01 | 49.6% |
| Fuchun Dye and Weave Group (SHSE:605189) | CN¥15.73 | CN¥31.37 | 49.9% |
| Double Medical Technology (SZSE:002901) | CN¥39.70 | CN¥78.90 | 49.7% |
| Aurubis (XTRA:NDA) | €140.50 | €278.64 | 49.6% |
| Apex Mining (PSE:APX) | ₱16.68 | ₱33.32 | 49.9% |
| Accton Technology (TWSE:2345) | NT$1775.00 | NT$3537.70 | 49.8% |
Below we spotlight a couple of our favorites from our exclusive screener.
Penta-Ocean Construction (TSE:1893)
Overview: Penta-Ocean Construction Co., Ltd. is involved in civil engineering and building construction projects across Japan, Southeast Asia, and internationally, with a market cap of ¥370.49 billion.
Operations: The company generates revenue from its Domestic Civil Engineering Business at ¥338.31 billion, Domestic Construction Business at ¥264.77 billion, and Overseas Construction Business at ¥194 billion.
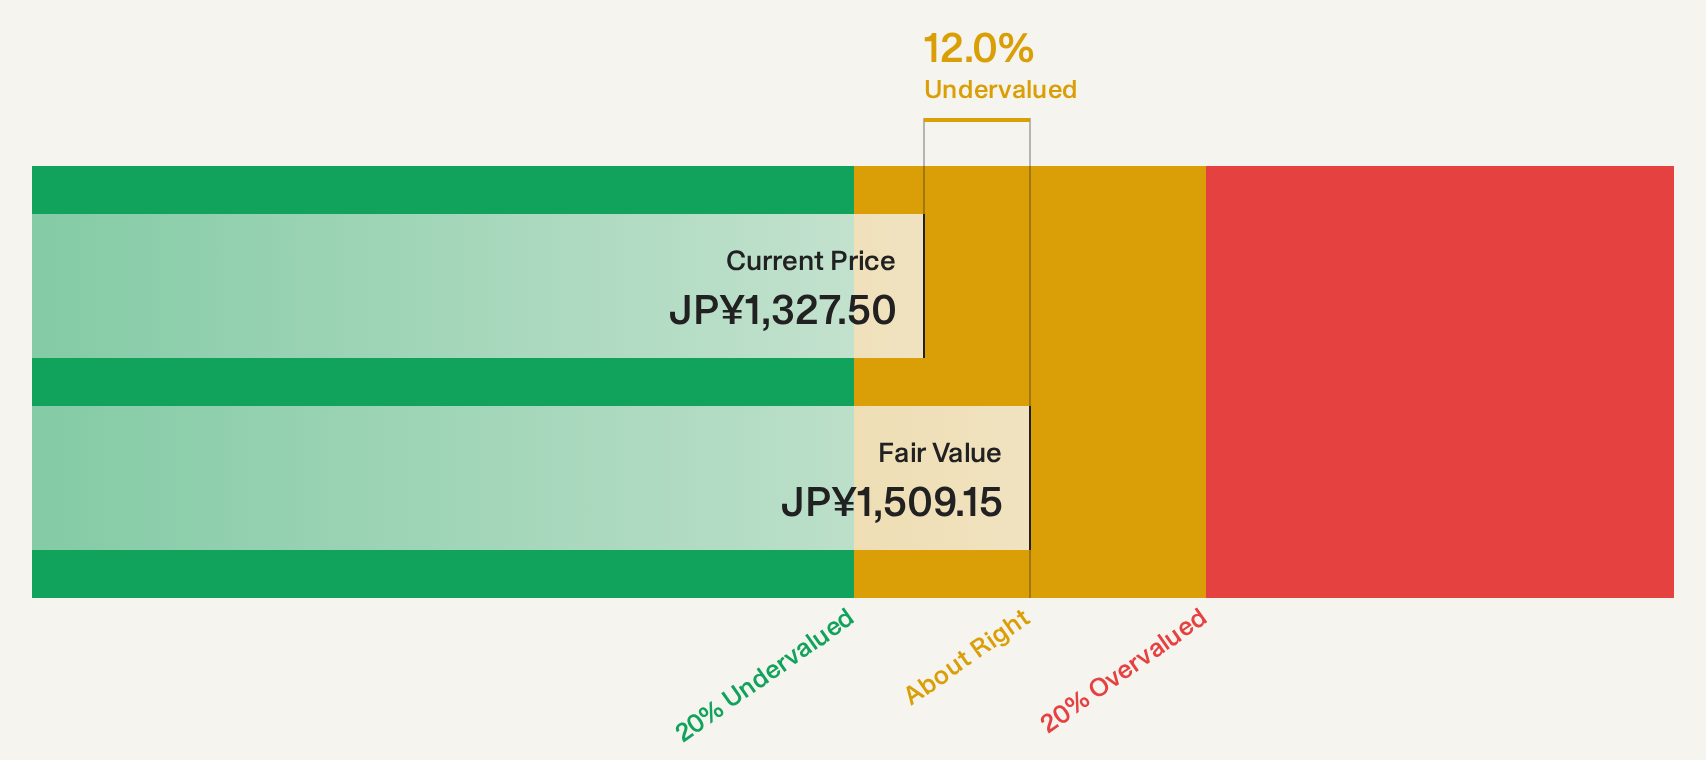
Estimated Discount To Fair Value: 11.1%
Penta-Ocean Construction is trading at a good value compared to peers, with its current price below the estimated future cash flow value of ¥1504.22. Despite a strong 146.9% earnings growth last year, forecasted revenue and profit growth are slower than the market average, and the company carries high debt levels. Analysts agree on potential stock price appreciation by 64.5%, though dividend coverage by free cash flows remains weak at 3.89%.
- Insights from our recent growth report point to a promising forecast for Penta-Ocean Construction's business outlook.
- Take a closer look at Penta-Ocean Construction's balance sheet health here in our report.
Toenec (TSE:1946)
Overview: Toenec Corporation operates in Japan, focusing on facility construction work, with a market cap of ¥189.64 billion.
Operations: The company's revenue is primarily derived from the Equipment Installation Business (excluding Energy Business) at ¥255.31 billion and the Energy Business at ¥12.48 billion.
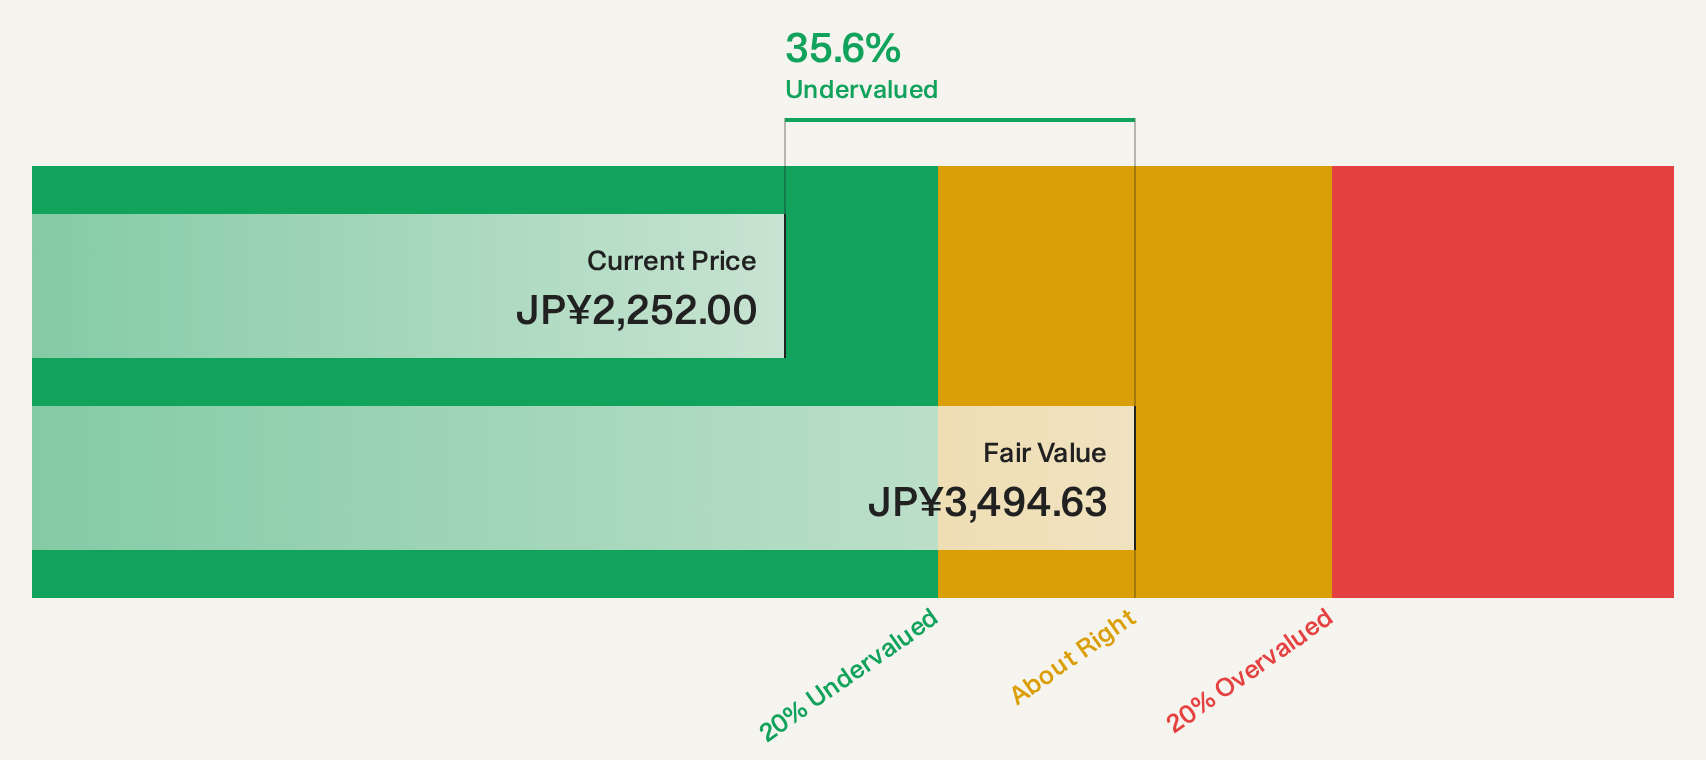
Estimated Discount To Fair Value: 41.3%
Toenec is trading at 41.3% below its estimated fair value, with a current price of ¥2026 compared to a future cash flow value of ¥3449.9. Recent earnings growth was strong, with net income rising from ¥2.06 billion to ¥4.39 billion year-over-year, yet future revenue and profit growth are expected to lag behind market averages at 3.4% annually. The dividend track record remains unstable despite recent earnings improvements.
- Upon reviewing our latest growth report, Toenec's projected financial performance appears quite optimistic.
- Get an in-depth perspective on Toenec's balance sheet by reading our health report here.
Wacom (TSE:6727)
Overview: Wacom Co., Ltd. develops, manufactures, and sells pen tablets and related software both in Japan and internationally, with a market cap of approximately ¥112.05 billion.
Operations: The company generates revenue through its Branded Products Business, contributing ¥34.61 billion, and its Technology Solution Business, which accounts for ¥73.53 billion.
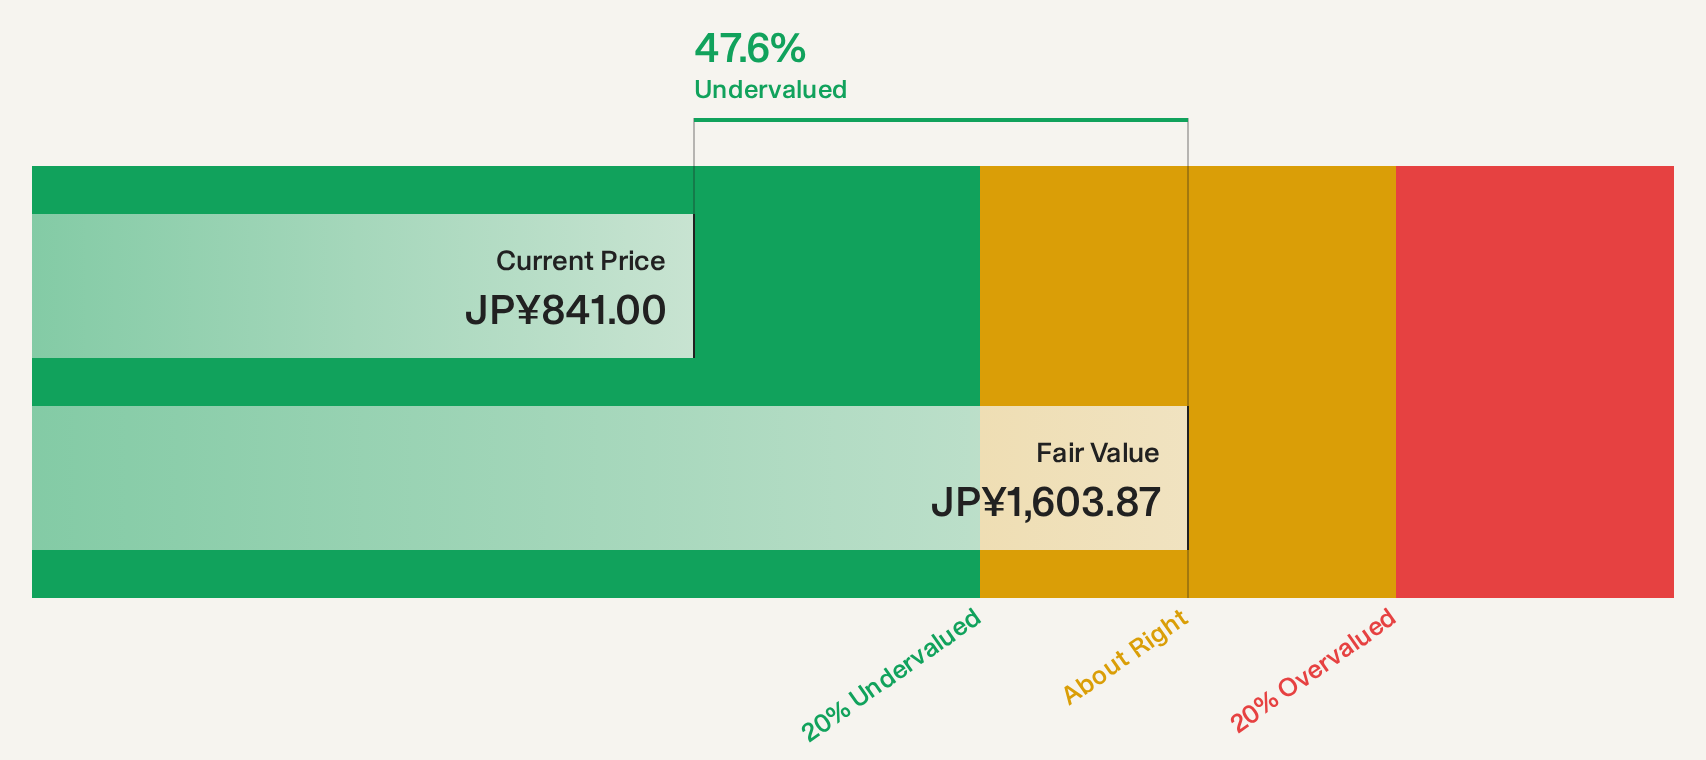
Estimated Discount To Fair Value: 46.8%
Wacom's current price of ¥863 is significantly below its estimated future cash flow value of ¥1621.31, indicating it may be undervalued. Recent earnings growth was robust, with net income increasing from ¥1.64 billion to ¥2.05 billion year-over-year, yet future earnings growth is projected at 5.2% annually, slower than the market average. Despite trading at a good relative value compared to peers and industry standards, Wacom’s dividend track record remains unstable.
- Our expertly prepared growth report on Wacom implies its future financial outlook may be stronger than recent results.
- Click to explore a detailed breakdown of our findings in Wacom's balance sheet health report.
Where To Now?
- Investigate our full lineup of 256 Undervalued Global Stocks Based On Cash Flows right here.
- Have you diversified into these companies? Leverage the power of Simply Wall St's portfolio to keep a close eye on market movements affecting your investments.
- Join a community of smart investors by using Simply Wall St. It's free and delivers expert-level analysis on worldwide markets.
Contemplating Other Strategies?
- Explore high-performing small cap companies that haven't yet garnered significant analyst attention.
- Diversify your portfolio with solid dividend payers offering reliable income streams to weather potential market turbulence.
- Fuel your portfolio with companies showing strong growth potential, backed by optimistic outlooks both from analysts and management.
This article by Simply Wall St is general in nature. We provide commentary based on historical data and analyst forecasts only using an unbiased methodology and our articles are not intended to be financial advice. It does not constitute a recommendation to buy or sell any stock, and does not take account of your objectives, or your financial situation. We aim to bring you long-term focused analysis driven by fundamental data. Note that our analysis may not factor in the latest price-sensitive company announcements or qualitative material. Simply Wall St has no position in any stocks mentioned.
Have feedback on this article? Concerned about the content? Get in touch with us directly. Alternatively, email editorial-team@simplywallst.com