


W. R. Berkley (WRB) just posted record third quarter operating earnings, even as reported revenue for the period held roughly flat and reinsurance premiums contracted in a tougher pricing backdrop.
The record operating result has arrived alongside a clear turn in sentiment. W. R. Berkley’s 1 month share price return of 8.07% has picked up after a quieter few months, while the 3 year total shareholder return of 78.53% reflects longer term momentum behind the story.
Scan other insurance stocks showing disciplined underwriting and tighter risk control in the same vein as W. R. Berkley’s quarter by reviewing the hand-picked 31 resilient stocks with low risk scores.
After a sharp run over the past month, the question around W. R. Berkley is simple. Has the recent re‑rating already captured the quality of this quarter, or is the valuation still leaving clear upside on the table?
Most Popular Narrative: 7% Overvalued
Against the latest close at $74.34, the most followed narrative pegs fair value for W. R. Berkley at $69.41, using a 7.24% discount rate and a detailed earnings outlook to frame that gap.
The current valuation, alongside this narrative’s view that W. R. Berkley is fairly valued and positive on its prospects, implies that the market is already pricing in sustained high returns on equity and ongoing capital returns through dividends and share repurchases.
See why 6 investors see W. R. Berkley as 7% overvalued.
Result: Fair Value of $69.41 (OVERVALUED)
Still, the W. R. Berkley narrative can be tested if softening commercial pricing compresses underwriting margins or if ongoing pullbacks in reinsurance leave overall premium volume under pressure.
Find out about the key risks to this W. R. Berkley narrative.
Another View: Cash Flows Point To Upside
Analysts framing W. R. Berkley as 7% overvalued are leaning on earnings based assumptions. A different lens tells a very different story. The Simply Wall St DCF model estimates future cash flows imply a value of $127.37 per share, which is well above the current $74.34 price.
That kind of gap means anyone relying only on P/E based targets could be underestimating how long high quality earnings and reinvestment may support cash generation. The real question is which lens you trust more when those two signals point in opposite directions.
Look into how the SWS DCF model arrives at its fair value.
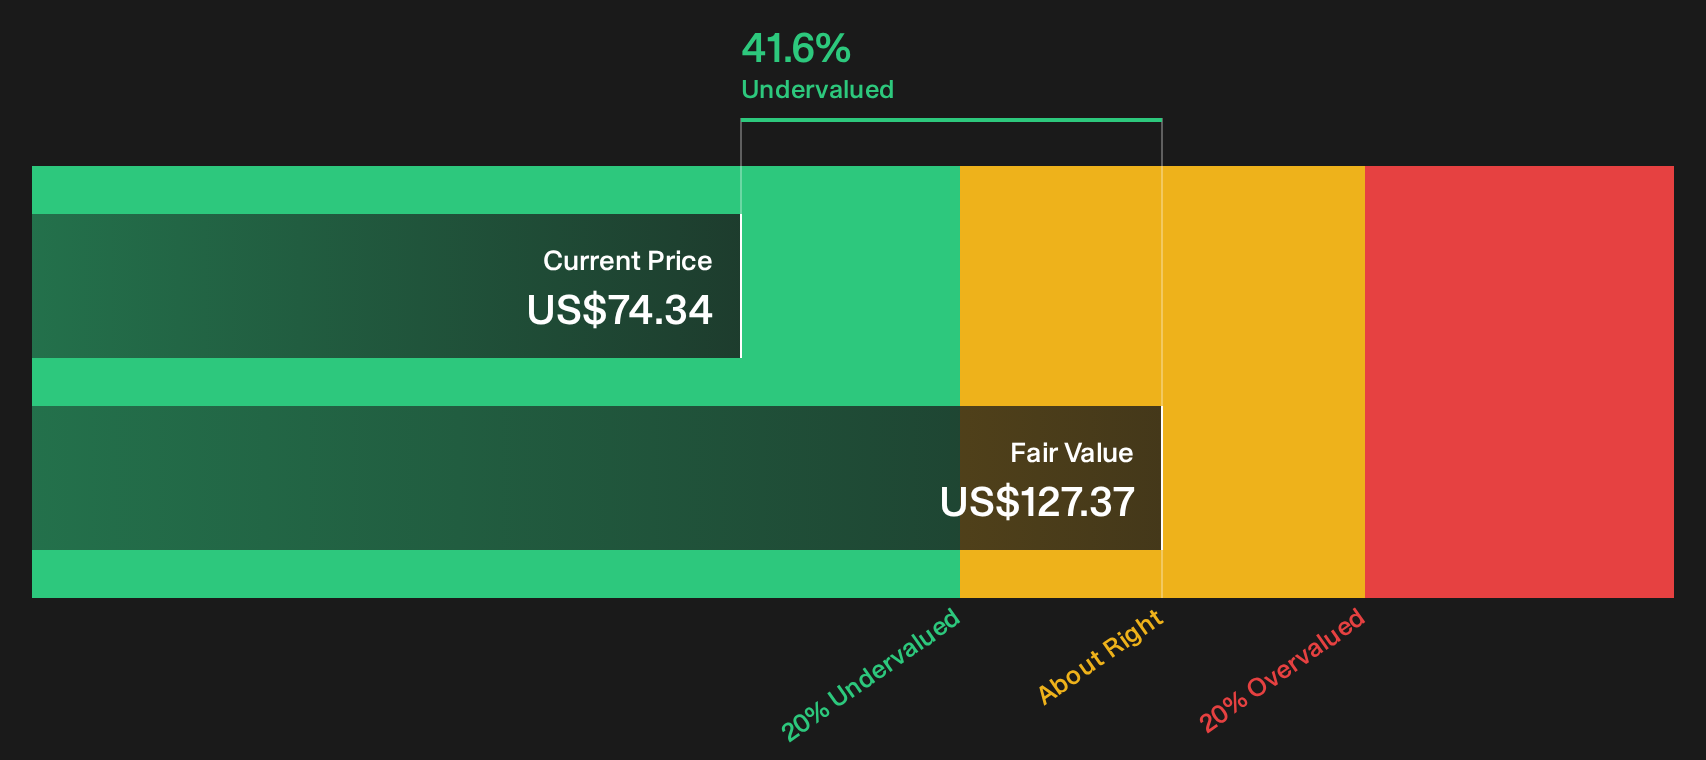
Simply Wall St performs a discounted cash flow (DCF) on every stock in the world every day (check out W. R. Berkley for example). We show the entire calculation in full. You can track the result in your watchlist or portfolio and be alerted when this changes, or use our stock screener to discover 33 high quality undervalued stocks. If you save a screener we even alert you when new companies match - so you never miss a potential opportunity.
Next Steps
Mixed messages on W. R. Berkley’s value thesis are clear. Move quickly, review the full data set, and weigh both sides for yourself. To see both the concern and the optimism laid out in one place, start with the 1 key reward and 1 important warning sign.
Looking for more investment ideas beyond W. R. Berkley?
If you stop with W. R. Berkley, you risk missing other opportunities that fit your style, your risk comfort, and the type of returns you are targeting.
- Target stability first and scan a curated list of solid balance sheet and fundamentals (25 results) that spotlights businesses with robust finances and fewer balance sheet surprises.
- Hunt for mispriced potential and sift through the 33 high quality undervalued stocks that focuses on quality companies trading below their assessed worth.
- Build an income focused watchlist and review the 7 dividend fortresses to find payouts that may complement capital growth ideas.
Have feedback on this article? Concerned about the content? Get in touch with us directly. Alternatively, email editorial-team@simplywallst.com