


Old National Bancorp (ONB) drew fresh investor attention after issuing 2026 earnings guidance that targets EPS growth above 15%, along with third quarter results and an update on its ongoing share repurchase activity.
At a share price of US$24.59, Old National Bancorp has given investors a 9.05% year to date share price return, while total shareholder return over one year is 21.05% and the three year total shareholder return of roughly 2x hints at momentum that has been building rather than fading.
Scan how Old National Bancorp compares with other regional financials by reviewing a hand picked set of list of solid balance sheet and fundamentals (25 results) that may be positioned for the next phase of this banking cycle.
Old National Bancorp now trades off a strong run, fresh EPS guidance and an active buyback. Does it make more sense to enter at this price, or to wait for a cheaper setup once the dust settles on valuation?
Price-to-Earnings of 10.8x: Is it justified?
On valuation, Old National Bancorp screens as inexpensive using a simple yardstick. At a P/E of 10.8x, the stock is assessed as good value both against a fair P/E estimate of 13x and against several banking peers.
The P/E ratio links what you pay for each share to the earnings that Old National Bancorp produces today. For a regional bank that already earns a 10.3% return on equity and has high quality earnings, this metric provides a straightforward gauge of how the market is pricing that profitability.
ONB is flagged as trading at good value versus the US Banks industry average P/E of 11.5x and a peer average of 11.9x. The fair P/E ratio of 13x indicates a level the market could move towards if sentiment and fundamentals stay aligned with current assessments. This would represent investors being willing to pay more for the same earnings stream.
Explore the SWS fair ratio for Old National Bancorp.
Result: Price-to-Earnings of 10.8x (UNDERVALUED)
Still, Old National Bancorp faces potential pressure if loan demand softens or credit quality weakens, especially given its heavy focus on U.S. community banking.
Find out about the key risks to this Old National Bancorp narrative.
Another View: What The DCF Is Saying About Old National Bancorp
The P/E story tilts cheap, yet the SWS DCF model paints Old National Bancorp as even more heavily discounted. With the shares at $24.59 against an estimated future cash flow value of $52.63, the DCF lens flags a wide gap that could either signal opportunity or model risk. Which side do you think is off?
Look into how the SWS DCF model arrives at its fair value.
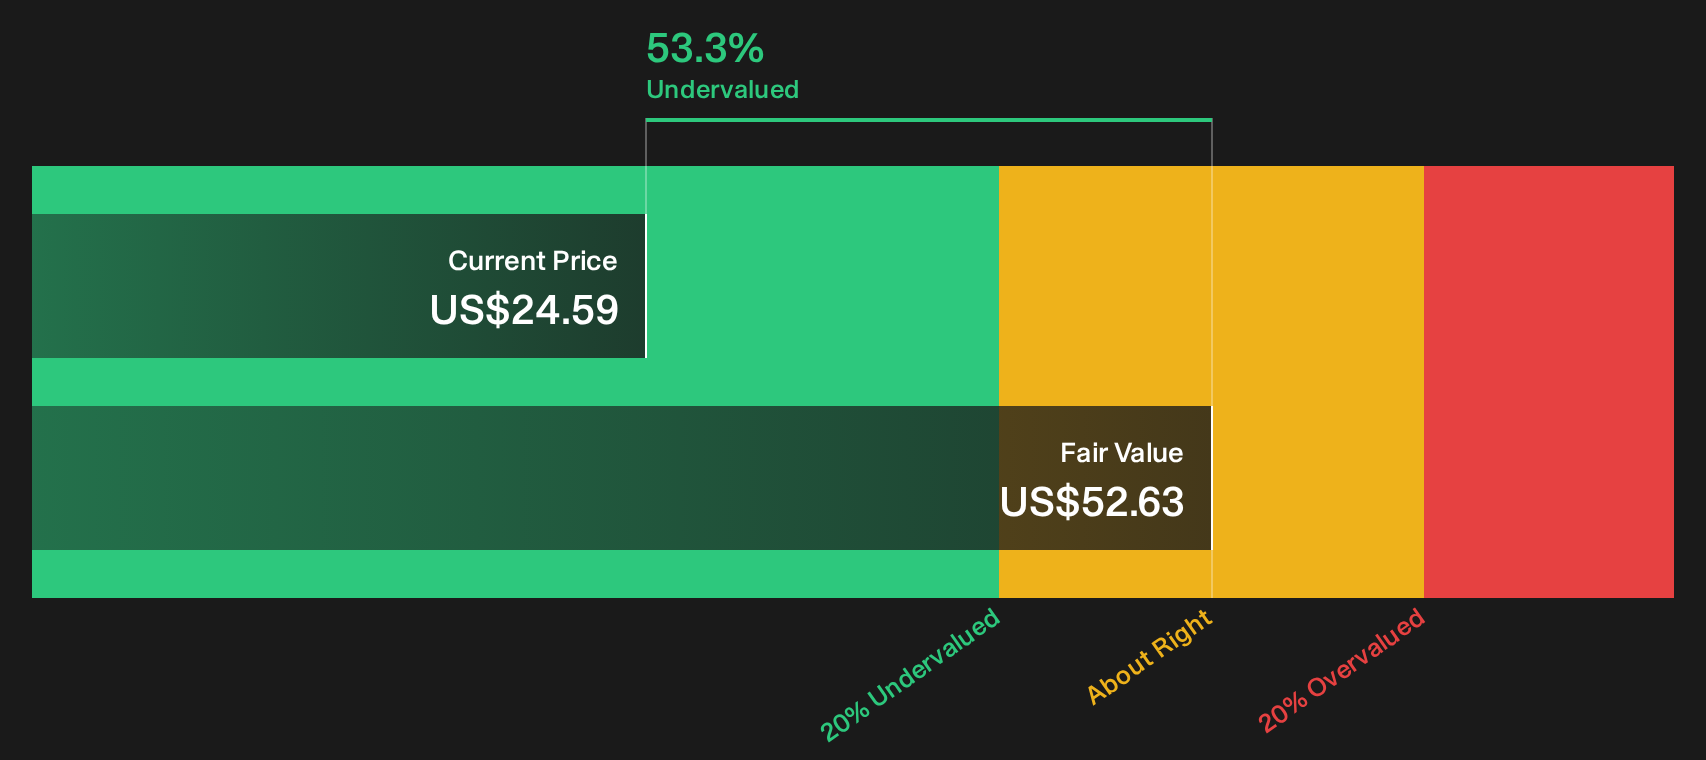
Simply Wall St performs a discounted cash flow (DCF) on every stock in the world every day (check out Old National Bancorp for example). We show the entire calculation in full. You can track the result in your watchlist or portfolio and be alerted when this changes, or use our stock screener to discover 33 high quality undervalued stocks. If you save a screener we even alert you when new companies match - so you never miss a potential opportunity.
Next Steps
Unsure about Old National Bancorp after all of this, or starting to lean one way? Move quickly, review the data, and weigh both the potential benefits and the caution signals for yourself with the 5 key rewards and 1 important warning sign.
Looking for more investment ideas beyond Old National Bancorp?
If Old National Bancorp has sharpened your focus, do not stop here. Broaden your watchlist with fresh ideas sourced from objective, data driven screeners.
- Target resilience by reviewing a 31 resilient stocks with low risk scores that can help you avoid fragile balance sheets when conditions get tougher.
- Chase value by scanning a 33 high quality undervalued stocks that highlights businesses where price and fundamentals are still out of sync.
- Hunt for future leaders by checking a 21 high quality undiscovered gems before the wider market starts paying attention.
Have feedback on this article? Concerned about the content? Get in touch with us directly. Alternatively, email editorial-team@simplywallst.com