


U.S. Physical Therapy (USPH) is back on investor calendars with an upcoming earnings release for the three and nine months ended September 30, 2026, scheduled after the close on Wednesday, November 4.
Recent trading has been constructive for U.S. Physical Therapy, with a 30-day share price return of 4.65% and a 90-day gain of 18.24%. However, the 1-year total shareholder return is down 1.88%, suggesting short term momentum is improving while longer term holders have seen more muted results.
Compare U.S. Physical Therapy's setup ahead of earnings with a hand picked group of healthcare peers and other potential breakouts in the 31 resilient stocks with low risk scores.
The recent rebound in U.S. Physical Therapy raises a simple tension. Has the bulk of the move already played out, or does the current valuation still leave meaningful room for upside?
Most Popular Narrative: 11% Undervalued
On the most followed view, U.S. Physical Therapy screens as undervalued, with a fair value estimate of $97 against a last close of $86.28, which puts the spotlight on whether record clinic activity and cost work can eventually reshape earnings power.
Hospital affiliation expansion, with dozens of clinics already integrated and more scheduled to follow along with management pointing to a larger than previously expected EBITDA contribution in 2027, gives a clearer line of sight to additional revenue and profit streams that are not yet fully reflected in reported earnings.
See why 1 investors see U.S. Physical Therapy as 11% undervalued.
Result: Fair Value of $97 (UNDERVALUED)
Still, reimbursement pressure and rising employee medical costs leave plenty of room for the U.S. Physical Therapy story to disappoint if those headwinds intensify.
Find out about the key risks to this U.S. Physical Therapy narrative.
Another View: What Multiples Say About U.S. Physical Therapy
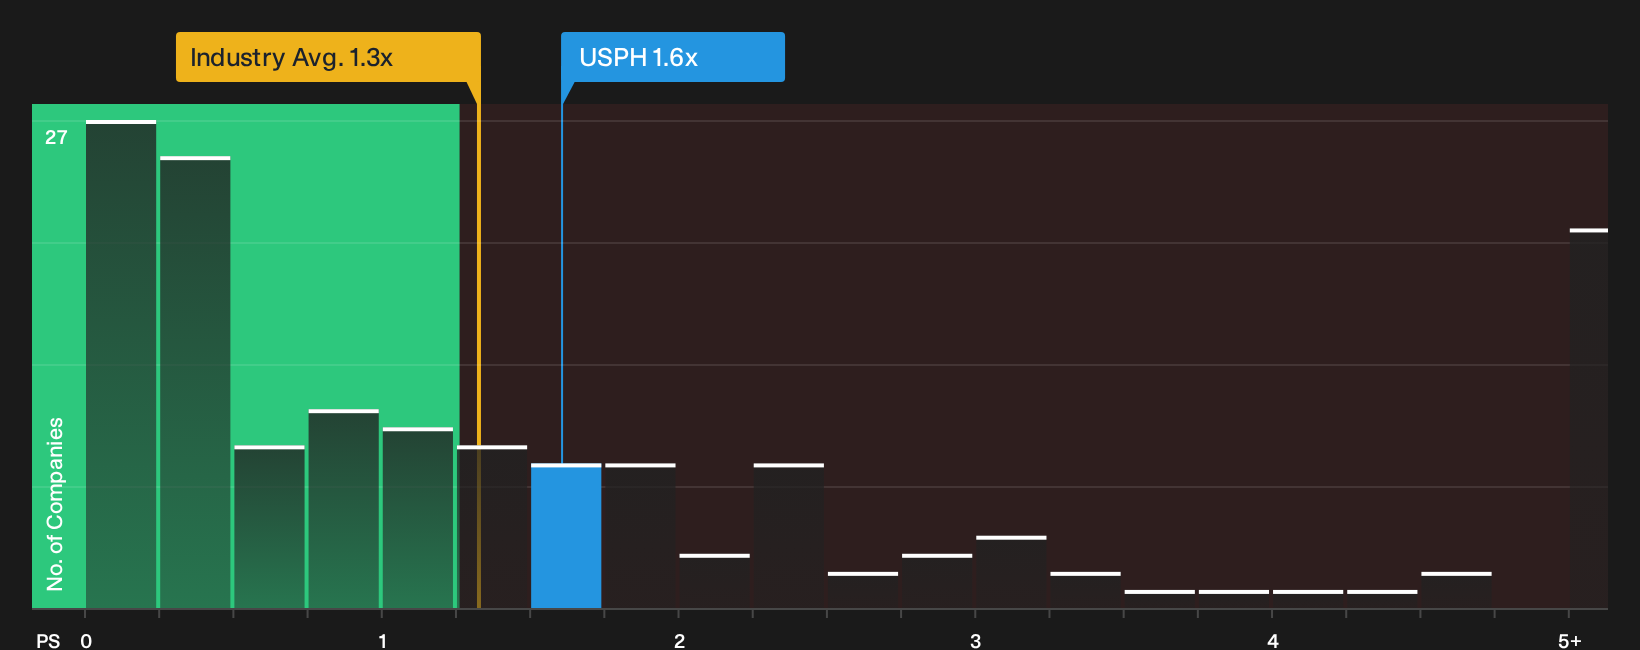
Switch the lens from discounted cash flows to simple sales-based pricing and the picture gets less generous for U.S. Physical Therapy. The P/S ratio sits at 1.6x, compared with 1.3x for the wider US Healthcare group and 1.2x for peers, while the fair ratio model points to 0.8x. That gap suggests less margin for error if the earnings narrative stumbles.
See what the numbers say about this price in our valuation breakdown, then decide which story you find more convincing: the cash flow view or the market multiple one through the See what the numbers say about this price — find out in our valuation breakdown..
Next Steps
Mixed signals around U.S. Physical Therapy can be confusing, so move quickly, test the numbers yourself, weigh both the upside and the downside, and then check the 2 key rewards and 2 important warning signs.
Looking for more investment ideas beyond U.S. Physical Therapy?
If U.S. Physical Therapy has your attention, broaden your watchlist with fresh ideas that match your style, risk tolerance, and income goals.
- Target long term value hunters by checking stocks on the 33 high quality undervalued stocks that combine quality fundamentals with pricing that may appeal to patient investors.
- Build a portfolio with staying power by reviewing companies in the list of solid balance sheet and fundamentals (25 results) that show robust financial footing and resilient fundamentals.
- Hunt for underfollowed opportunities by scanning the 21 high quality undiscovered gems that might sit off the usual radar yet still offer compelling fundamentals.
Have feedback on this article? Concerned about the content? Get in touch with us directly. Alternatively, email editorial-team@simplywallst.com