


Kadokawa stock moves after recent performance data
Kadokawa (TSE:9468) has been drawing fresh attention after recent performance figures showed mixed short term moves alongside stronger medium term gains, prompting investors to reassess how the entertainment group is currently priced.
The share price recently closed at ¥3,806, with the stock roughly flat over the past week and slightly lower over the last day, yet showing gains over the past month and past 3 months.
For context, Kadokawa’s 30-day share price return of 4.7% and 90-day move of 9.34% point to building momentum, while the year-to-date share price gain of 21.75% and 1-year total shareholder return of 9.92% place the recent strength within a longer performance record.
Scan how Kadokawa’s recent momentum compares with other potential breakouts by reviewing the hand picked 73 high quality undiscovered gems for ideas beyond this single ticker.
After that mix of short term hesitation and healthier multi month gains, the real tension around Kadokawa now is simple. Is most of the share price progress already booked, or is there still meaningful upside ahead as valuation gets unpacked next?
Preferred price-to-sales multiple of 2x: Is it justified for Kadokawa?
On valuation, Kadokawa carries a P/S ratio of 2x, which leaves the current share price of ¥3,806 looking expensive compared with both its peer group and broader media rivals.
The P/S multiple compares the market value of the equity with the last reported revenue. It effectively shows how much investors are paying for each yen of Kadokawa’s sales. For a diversified entertainment group with exposure to publishing, animation, gaming, web services and education, this measure is often used when earnings are volatile or, as in this case, the company is loss making.
Here the signal is clear. The P/S of 2x is higher than the peer average of 1.3x and also above the JP Media industry average of 0.9x. Even though it is close to the estimated fair P/S ratio of 2.1x that markets could gravitate toward, the stock still trades at a richer level than many domestic comparables.
Explore the SWS fair ratio for Kadokawa.
Result: Price-to-sales of 2x (OVERVALUED)
Still, the recent net loss of ¥6,120 and analyst price target of ¥3,245 could challenge the bullish case around Kadokawa if sentiment shifts.
Find out about the key risks to this Kadokawa narrative.
Another view on Kadokawa’s value: cash flows paint a starker picture
Price to sales hints that Kadokawa is expensive but not wildly so. The SWS DCF model is harsher. With the share price at ¥3,806 and future cash flow value estimated at ¥2,588.08, the stock screens as overvalued on this lens. Which signal might be more useful for your analysis?
For investors who want to see how those cash flow assumptions are built and tested in detail, Look into how the SWS DCF model arrives at its fair value.
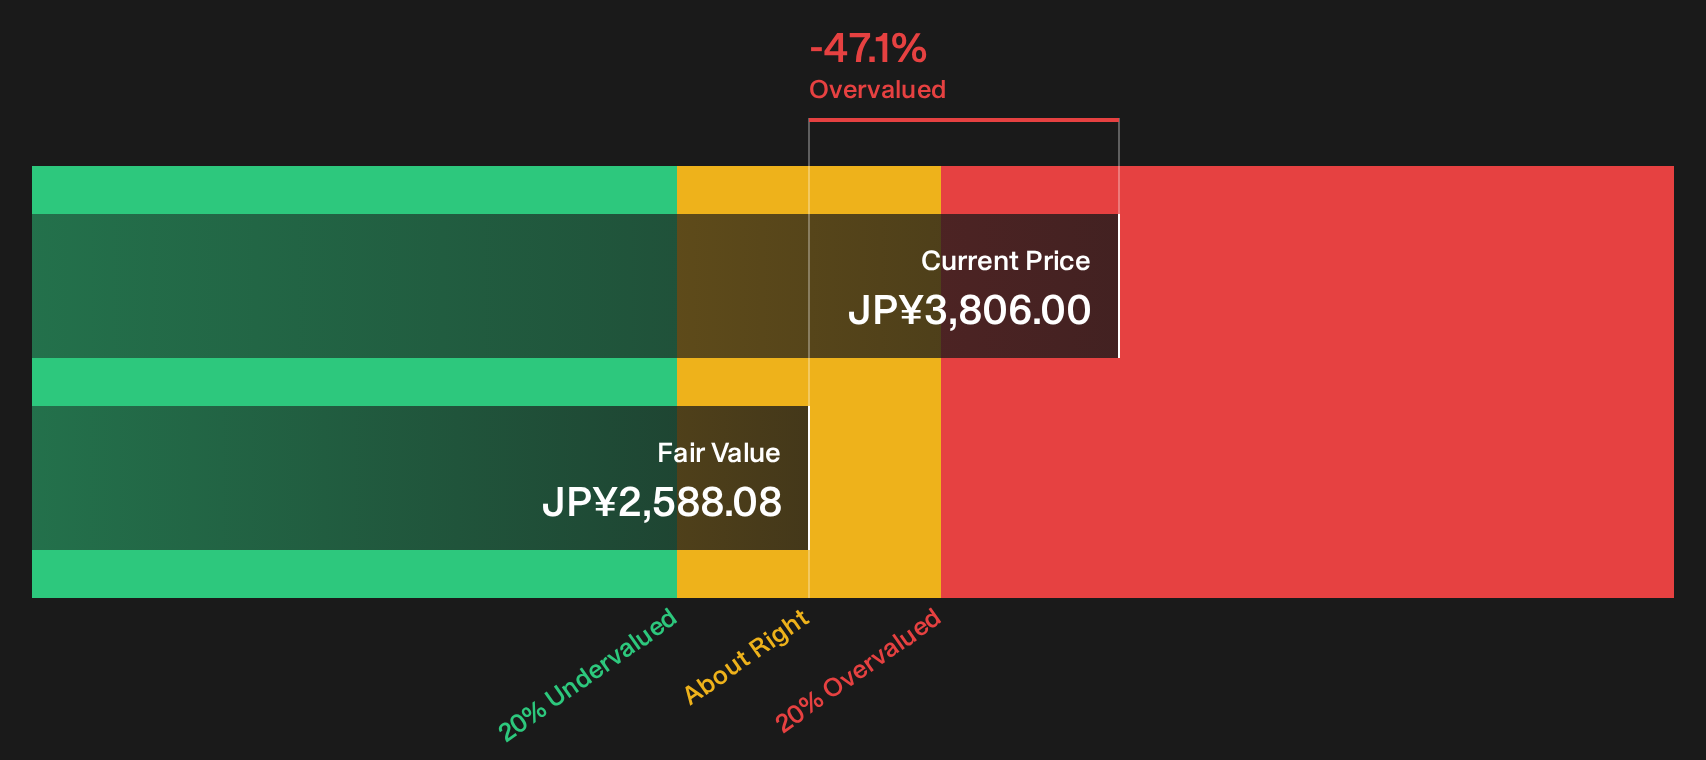
Simply Wall St performs a discounted cash flow (DCF) on every stock in the world every day (check out Kadokawa for example). We show the entire calculation in full. You can track the result in your watchlist or portfolio and be alerted when this changes, or use our stock screener to discover 14 high quality undervalued stocks. If you save a screener we even alert you when new companies match - so you never miss a potential opportunity.
Next Steps
Sentiment around Kadokawa is clearly split, so treat this as a prompt to move quickly, dig through the numbers, and punch in your own verdict. To see where the optimism comes from and which potential upsides matter most for your thesis, start with the 1 key reward
Looking for more investment ideas beyond Kadokawa?
If you stop with Kadokawa here, you risk missing other opportunities that better match your risk tolerance, income needs, or value focus on Simply Wall Street.
- Target higher potential payoffs by scanning tightly filtered small caps through the 1 elite penny stocks with strong financials that already clear basic financial quality checks.
- Strengthen the quality of your portfolio by focusing on resilient businesses using the list of solid balance sheet and fundamentals (22 results) as a fast filter for financial robustness.
- Seek more consistent return profiles by tilting toward stability and predictability with the help of the 21 resilient stocks with low risk scores tailored shortlist.
Have feedback on this article? Concerned about the content? Get in touch with us directly. Alternatively, email editorial-team@simplywallst.com