


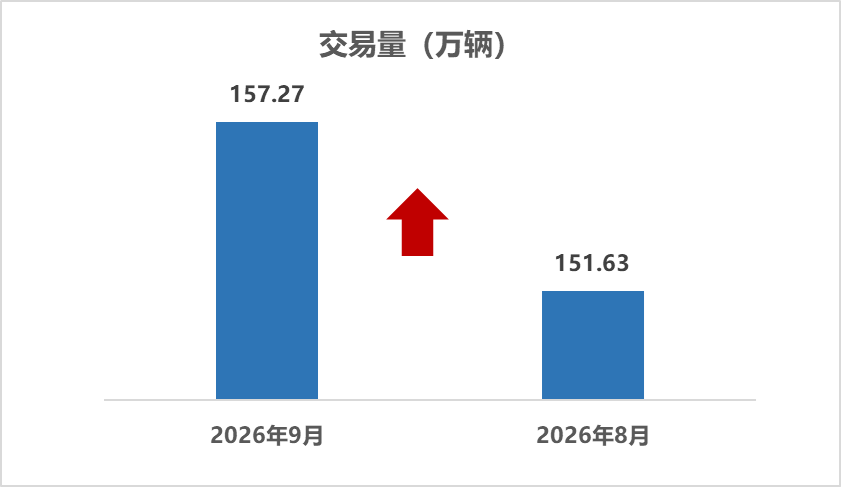
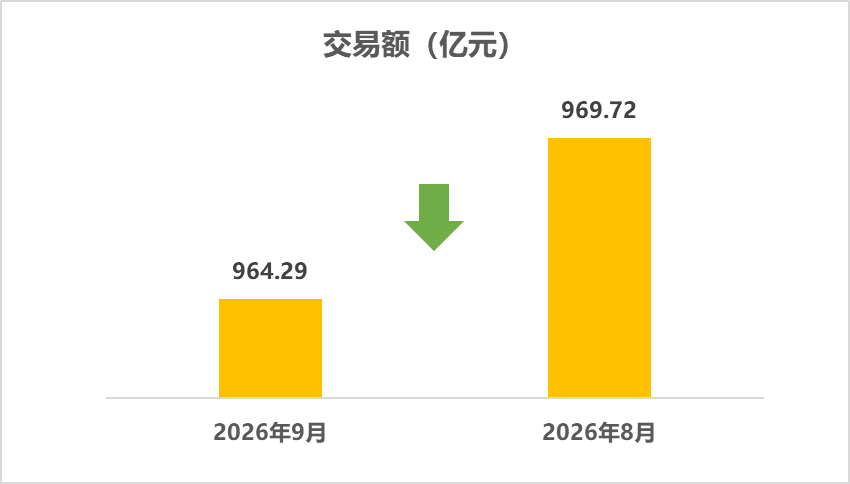
The Zhitong Finance App learned that according to data released by the China Automobile Dealers Association, in September 2026, the national used car market traded 1.572,700 vehicles, up 3.72% from the previous month, down 12.35% from the previous year, and the transaction amount was 96.429 billion yuan. From January to September 2026, the cumulative transaction volume of used cars was 14.3638 million units, a year-on-year decrease of 2.50%. Compared with the same period, a decrease of 36,900 units was reduced, and the cumulative transaction amount was 936.401 billion yuan.
Analysis of the structure of used cars by model in September 2026
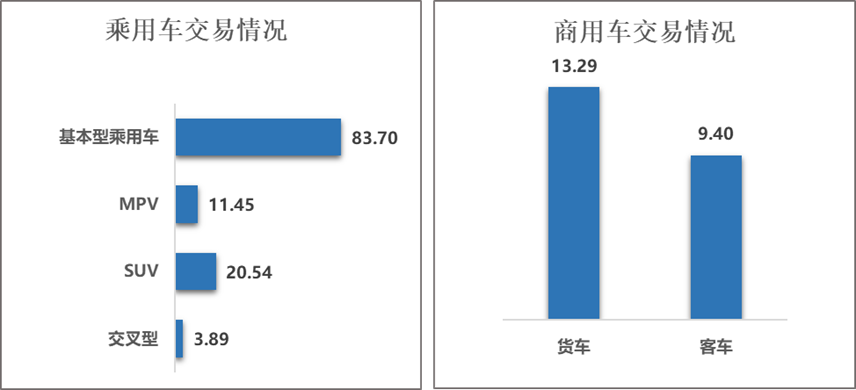
Passenger car situation: In September, 837,000 basic passenger cars were traded, up 3.53% from the previous year, down 15.18%; a total of 205,400 SUVs were traded, up 3.82% month-on-month, down 11.69%; MPVs traded 114,500 units, up 6.05% month-on-month, down 7.72%; and a total of 38,900 passenger cars were traded, up 4.66% month-on-month, down 10.81% year-on-year.
Commercial vehicle situation: A total of 94 million buses were traded, up 3.85% month-on-month, down 10.26%; 132,900 trucks, up 3.18% month-on-month and 15.59% year-on-year.
In January-September, a total of 10.9853 million passenger cars were traded, a year-on-year decrease of 5.15%. Among them: 7.722,600 basic passenger cars were traded, down 6.91% year on year; a total of 1.893,500 SUVs were traded, down 2.52% year on year; a total of 1.022,200 MPVs were traded, up 5.01% year on year; and 3471,000 passenger cars were traded, down 6.11% year on year.
A total of 2,0776,500 commercial vehicles were traded, a year-on-year decrease of 0.60%. Among them: 1,219,800 trucks were traded, a year-on-year decrease of 2.68%; 856,700 buses were traded, an increase of 2.52% year-on-year.
Analysis of the service life of used car trading vehicles in September 2026
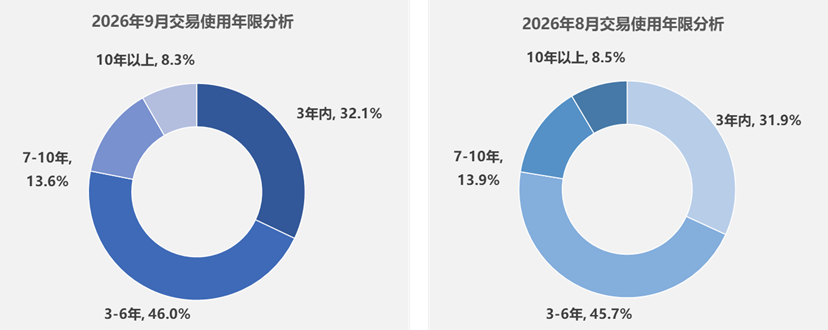
In September, used cars with a lifespan of 3-6 years accounted for the largest share of transactions, accounting for 46.0%, up 0.3 percentage points from month to month, up 4.9 percentage points from year to year; models with a usage period of 3 years accounted for 32.1%, up 0.2 percentage points from month to month, up 7.0 percentage points from year to year; models aged 7 to 10 years accounted for 13.6%, down 0.3 percentage points from month to month, down 7.6 percentage points from year on year; models over 10 years old accounted for 8.3%, down 0.2 percentage points from month on month, down 4.2 percentage points year on year.
Analysis of the situation in the six major regions in September 2026
Used car transactions in the six major regions in September 2026
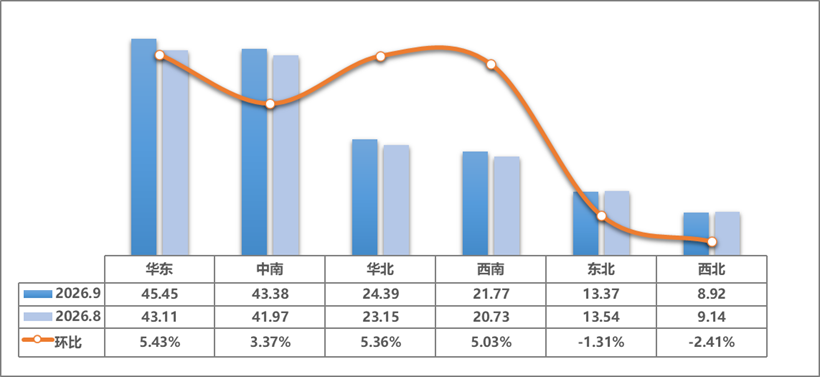
In September 2026, the national used car market ended the continuous pullback trend in the previous period. Most of the six major regions saw a month-on-month increase in transaction volume, and only a few regions continued to decline slightly. Trading volume in core regions generally rebounded: East China and North China led the increase, the southwest continued to rise and expand, and the increase in central and southern China was relatively moderate; Northeast China continued to decline but the decline narrowed markedly, the northwest declined slightly, and the overall national market picked up, and total trading volume continued to rise from the previous month.
The volume of used car transactions in East China was 454,500 units, up 5.43% from the previous month. The trading volume still ranks first in the country, and the leading position in the region is stable. This month, there was a marked recovery from a pullback in the previous period. The increase was higher than the national average. The previous contraction trend was reversed, and the rebound momentum was strong.
The volume of used car transactions in the central and southern regions was 433,800 units, up 3.37% from the previous month, and remained the second largest in the country in terms of transaction volume. This month changed from a decline in the previous period to a recovery, but the increase was slightly lower than the national average. Demand has recovered, and the trading volume gap with East China widened slightly compared to the previous month.
The volume of used car transactions in North China was 243,900 units, up 5.36% from the previous month, ranking third in the country. This month, there was a sharp rebound from a sharp decline in the previous period to a rapid recovery. The increase was significantly higher than the national average. The pressure of early adjustments eased somewhat, and the rebound was strong.
The volume of used car transactions in the southwest region was 217,700 units, up 5.03% from the previous month, and continues to rank fourth in the country in terms of transaction volume. This month continued the steady upward trend in the previous period and increased. The increase was higher than the national average. The upward trend was further established, showing continued resilience in the national market.
The volume of used car transactions in the Northeast region was 133,700 units, down 1.31% from the previous month, and still ranked fifth in the country in terms of transaction volume. The downward trend continued this month, but the decline was significantly narrower than the previous month. The sharp decline in the previous period eased somewhat, and the phased adjustment of the market slowed down.
The volume of used car transactions in the northwest region was 892,000 units, down 2.41% from the previous month. The slight decline continued this month. Affected by the small size of the base, the fluctuation was limited, and the overall operation remained relatively stable.
Cross-regional circulation situation in September 2026
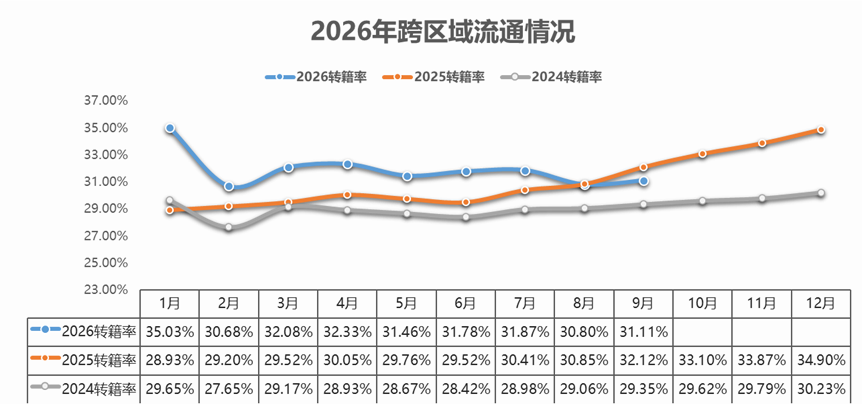
In September, the used car transfer rate was 31.11%, up 0.3 percentage points from the previous month and down 1 percentage point from the same period last year. The total number of used car transfers was 489,300, up 4.77% month-on-month and down 15.1% from the same period last year.