


In recent weeks, global markets have experienced significant volatility, with major U.S. indices such as the Nasdaq Composite and Russell 2000 facing notable declines due to concerns over AI-related investments and inflation pressures. Amid this backdrop, investors are increasingly turning their attention to small-cap stocks that demonstrate strong fundamentals as they seek opportunities beyond the large-cap growth sector. A good stock in today's market is often characterized by solid financial health and resilience in fluctuating economic conditions, making it a potential "undiscovered gem" for those looking to diversify their portfolios.
Top 10 Undiscovered Gems With Strong Fundamentals Globally
| Name | Debt To Equity | Revenue Growth | Earnings Growth | Health Rating |
|---|---|---|---|---|
| Ad-Sol Nissin | NA | 7.22% | 15.60% | ★★★★★★ |
| Chongqing Machinery & Electric | 18.92% | 8.43% | 26.16% | ★★★★★★ |
| Eurocharm Holdings | 2.66% | 3.48% | 7.39% | ★★★★★★ |
| Xiamen King Long Motor Group | 93.39% | 11.34% | 66.65% | ★★★★★☆ |
| Forth Smart Service | 44.85% | -3.80% | 10.19% | ★★★★★☆ |
| Silvery Dragon Group Tianjin | 25.01% | 2.55% | 25.62% | ★★★★★☆ |
| Sing Investments & Finance | 0.10% | 5.85% | 7.00% | ★★★★☆☆ |
| Shengda ResourcesLtd | 57.58% | 8.61% | 9.90% | ★★★☆☆☆ |
| Primo Global Holdings | 64.63% | 9.93% | 28.27% | ★★★☆☆☆ |
| HANA Micron | 137.37% | 21.15% | 26.62% | ★★★☆☆☆ |
Let's review some notable picks from our screened stocks.
Cenergy Holdings (ENXTBR:CENER)
Simply Wall St Value Rating: ★★★★☆☆
Overview: Cenergy Holdings SA is a company involved in the manufacturing and sale of aluminium, copper, cables, steel, and steel pipes across various regions including Europe, the United States, Asia, and Africa with a market capitalization of approximately €4.60 billion.
Operations: Cenergy Holdings generates its revenue primarily from the cables segment, which accounts for €2.55 billion, and the steel pipes segment, contributing €718.82 million. The company's net profit margin trends are noteworthy as they reflect its ability to manage costs relative to its revenue streams effectively.
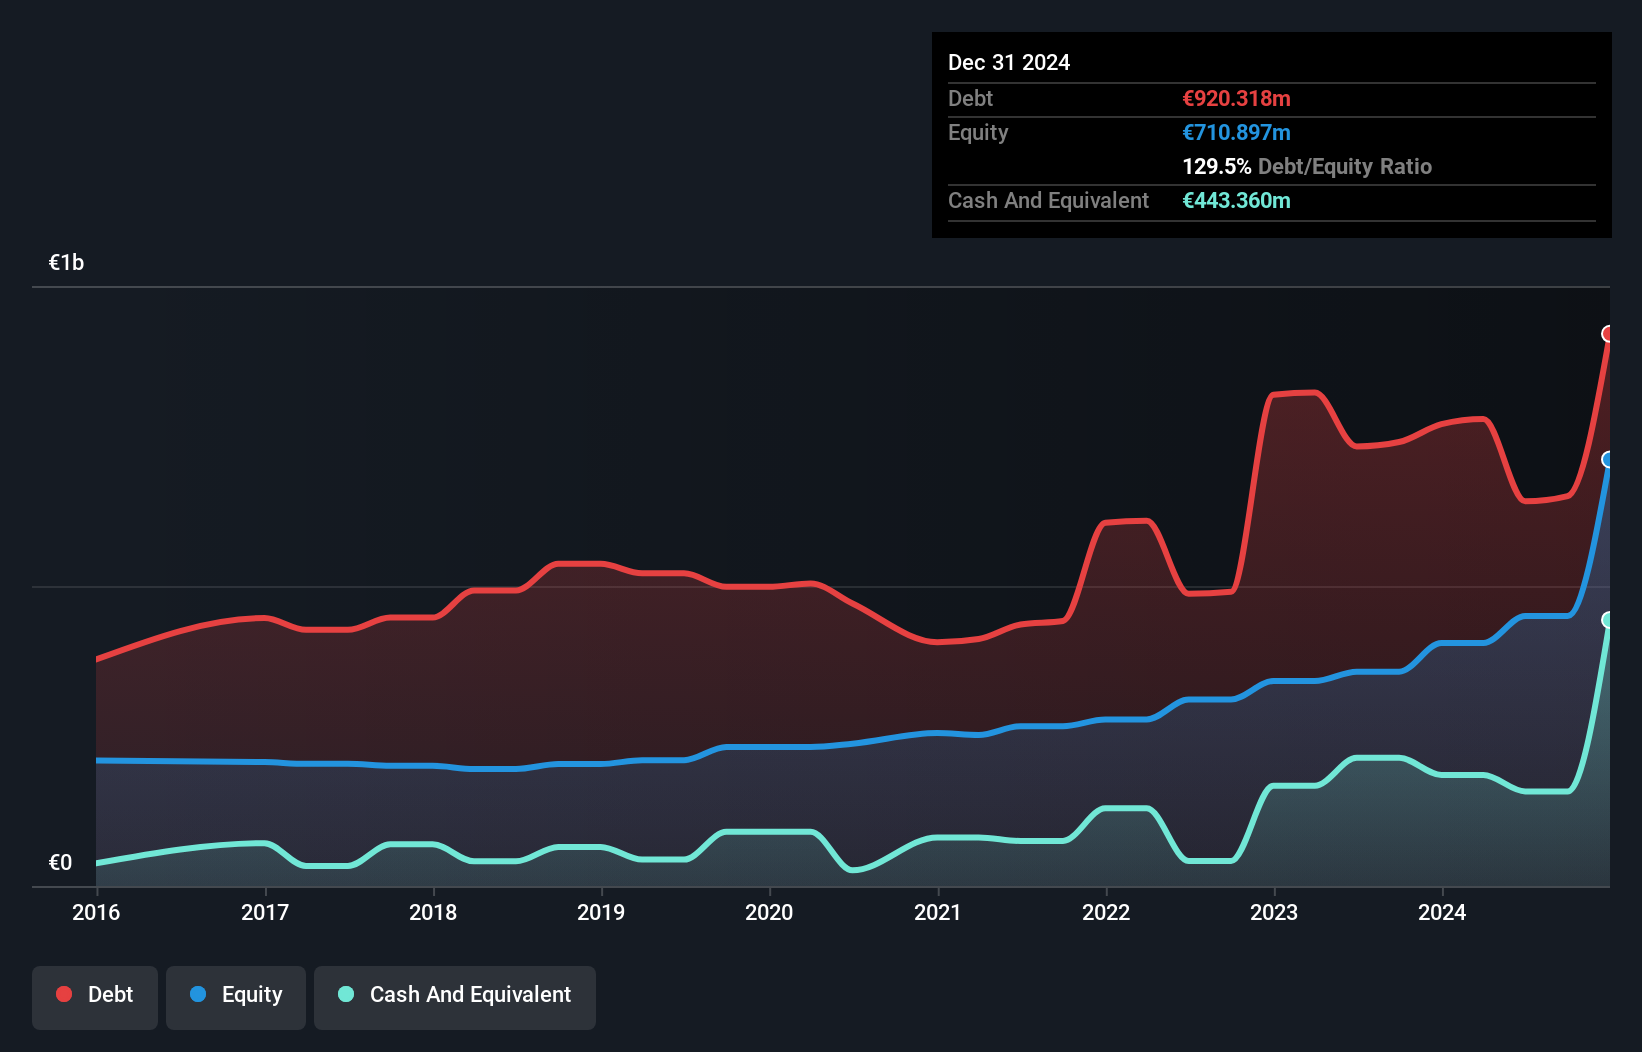
Cenergy Holdings, a promising player in the electrical sector, has seen its debt to equity ratio drop from 163.7% to 73.7% over five years, reflecting improved financial health. With earnings growing at an impressive 42.6% annually over the past five years and interest payments well covered by EBIT at 9.1 times, Cenergy shows solid operational strength. However, its net debt to equity ratio remains high at 44%, posing some risk despite trading at a good value compared to peers and industry standards. The company's share price is currently €22.16 with analysts projecting it could reach €29 based on future earnings expectations.
CW Enerji Mühendislik Ticaret ve Sanayi Anonim Sirketi (IBSE:CWENE)
Simply Wall St Value Rating: ★★★☆☆☆
Overview: CW Enerji Mühendislik Ticaret ve Sanayi Anonim Sirketi is engaged in the photovoltaic power generation sector in Turkey, with a market capitalization of TRY16.17 billion.
Operations: CW Enerji generates revenue primarily through its segments: CW Energy (TRY18.44 billion), CW Solar Cell (TRY4.25 billion), and CW International (TRY115.64 million). The segment adjustment accounts for TRY2.23 billion, while elimination corrections stand at -TRY7.22 billion, impacting the overall financials of the company significantly.
CW Enerji, a notable player in the electrical industry, has demonstrated impressive growth with earnings surging 340% over the past year, far outpacing the sector's 36.8%. Despite its profitability and trading at a good value relative to peers, interest payments remain under-covered by EBIT at 1.6 times. The net debt to equity ratio stands at a satisfactory 33.8%, though it has risen from 32.5% over five years. Recent reports highlight strong performance with sales reaching TRY 4,496 million in Q2 and net income climbing to TRY 500 million compared to TRY 284 million last year, reflecting robust operational momentum.

Shanghai Allist Pharmaceuticals (SHSE:688578)
Simply Wall St Value Rating: ★★★★★★
Overview: Shanghai Allist Pharmaceuticals Co., Ltd. is a pharmaceutical company focused on the research and development of tumor-targeted drugs in China and internationally, with a market cap of CN¥38.03 billion.
Operations: The primary revenue stream for Shanghai Allist Pharmaceuticals comes from its research and development of drugs, generating CN¥6.13 billion. The company's financial performance is highlighted by a net profit margin that reflects its operational efficiency in the pharmaceutical sector.
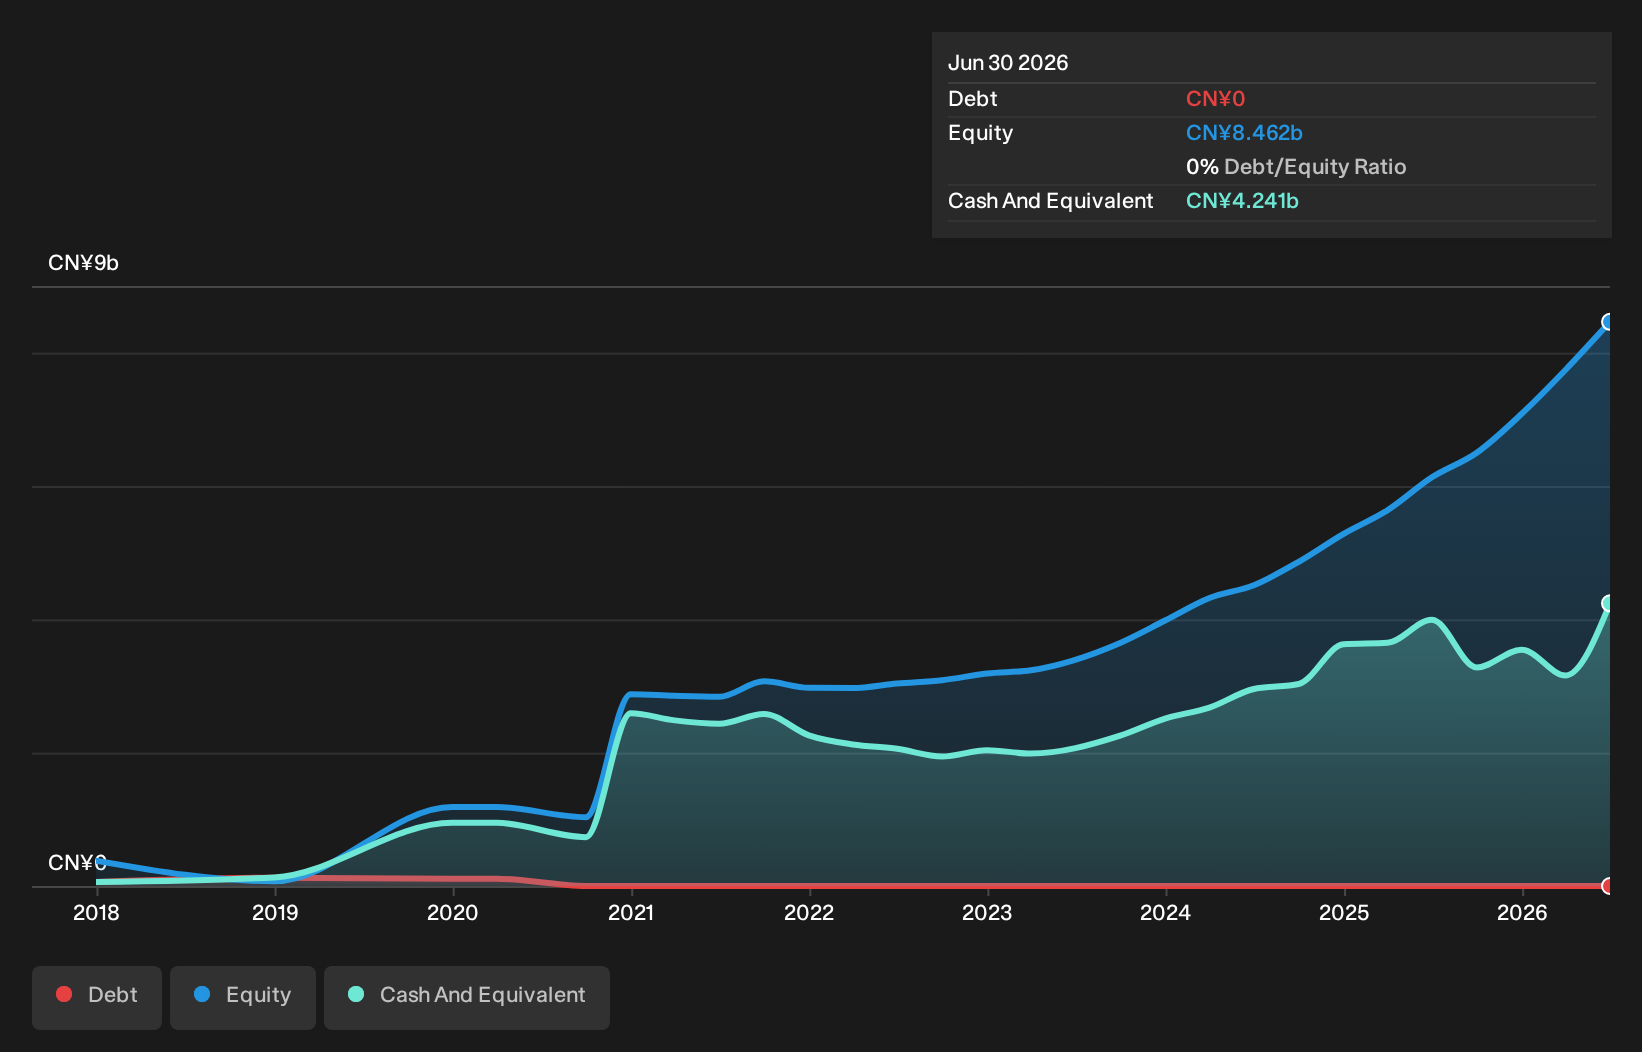
Shanghai Allist Pharmaceuticals showcases a robust financial profile, with earnings growth of 46.8% over the past year, significantly outpacing the pharmaceutical industry's -2.7%. The company is trading at 62.6% below its estimated fair value, suggesting potential undervaluation. Notably, it remains debt-free and has been for five years, which enhances its financial stability. Recent earnings for H1 2026 reported sales of CNY 3.32 billion and net income of CNY 1.54 billion, up from CNY 2.37 billion and CNY 1.05 billion respectively a year prior, indicating strong operational performance amidst industry challenges.
Make It Happen
- Click through to start exploring the rest of the 177 Global Undiscovered Gems With Strong Fundamentals now.
- Already own these companies? Link your portfolio to Simply Wall St and get alerts on any new warning signs to your stocks.
- Invest smarter with the free Simply Wall St app providing detailed insights into every stock market around the globe.
Looking For Alternative Opportunities?
- Explore high-performing small cap companies that haven't yet garnered significant analyst attention.
- Fuel your portfolio with companies showing strong growth potential, backed by optimistic outlooks both from analysts and management.
- Find companies with promising cash flow potential yet trading below their fair value.
This article by Simply Wall St is general in nature. We provide commentary based on historical data and analyst forecasts only using an unbiased methodology and our articles are not intended to be financial advice. It does not constitute a recommendation to buy or sell any stock, and does not take account of your objectives, or your financial situation. We aim to bring you long-term focused analysis driven by fundamental data. Note that our analysis may not factor in the latest price-sensitive company announcements or qualitative material. Simply Wall St has no position in any stocks mentioned.
Have feedback on this article? Concerned about the content? Get in touch with us directly. Alternatively, email editorial-team@simplywallst.com