


CECO Environmental (CECO) was recently dropped from the NASDAQ Composite index. This move can prompt short term trading shifts as index tracking funds rebalance their portfolios and adjust exposure.
At around US$57.49 per share, CECO Environmental has seen its short term share price momentum fade, with the stock down 14.6% over the past week and 29.7% over 90 days, even though total shareholder return over five years is very large at more than 7x. Recent weakness, including a 17.3% 30 day share price decline, lines up with the NASDAQ Composite removal, which can shift demand as index trackers sell. However, the 14.0% one year total shareholder return shows longer term holders have still seen meaningful gains through price moves and any reinvested income.
Scan how CECO Environmental compares with other industrial names under pressure from big index moves by reviewing our curated list of 29 high quality undervalued stocks.
Recent index selling has dragged CECO Environmental sharply lower. The key question now is whether that drop already offers a fair entry, or if patience still makes more sense as valuation comes into focus next.
Most Popular Narrative: 49% Undervalued
Against a last close of $57.49, the most followed narrative for CECO Environmental points to a fair value near $111.86. As a result, the recent index related selloff is being weighed against a materially higher long term valuation anchor that is built from backlog and project data.
Record orders of $799 million in Q2 2026, a book to bill ratio above 2.0 on a trailing 12 month basis, and a backlog of $1.82 billion that stretches into power generation projects through 2029 and 2030 indicate CECO Environmental still has a large volume of contracted work that is expected to convert into future revenue and earnings.
See why 12 investors see CECO Environmental as 49% undervalued.
Result: Fair Value of $111.86 (UNDERVALUED)
Still, the thesis around CECO Environmental depends heavily on large gas power projects and on Thermon integration risks, which could pressure margins and debt comfort if execution slips.
Find out about the key risks to this CECO Environmental narrative.
Another View: CECO Environmental Looks Expensive On Sales
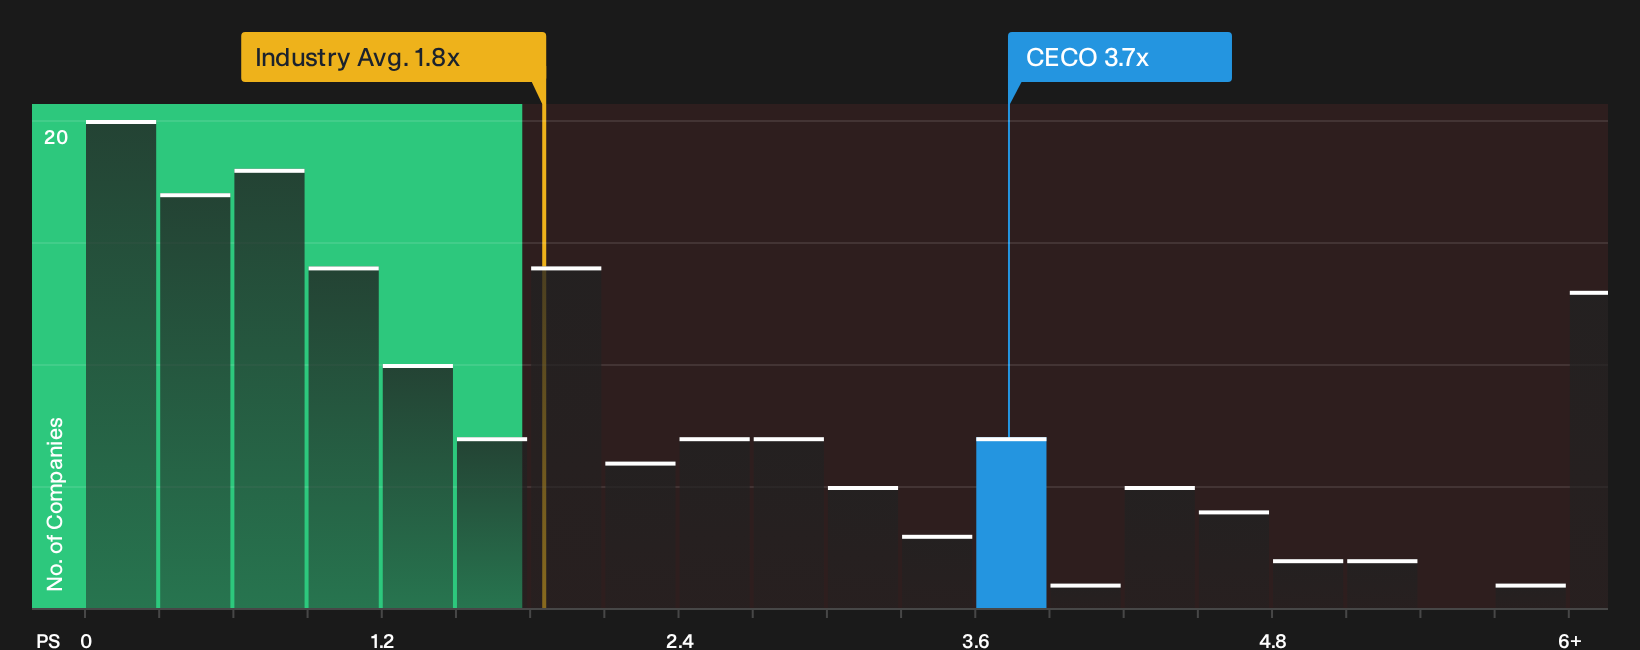
On the flip side of the SWS DCF model pointing to value, CECO Environmental trades on a P/S ratio of 3.7x. The US Machinery industry sits nearer 1.9x and direct peers around 2.7x, while the fair ratio is 5.3x. That gap can signal upside, but it also raises the risk that sentiment needs to stay very strong to support this kind of revenue multiple. Which signal do you trust more when the story gets bumpy?
See what the numbers say about this price, find out in our valuation breakdown See what the numbers say about this price — find out in our valuation breakdown.
Next Steps
Mixed signals around CECO Environmental can easily pull you in either direction, so consider taking the time to stress test the data yourself and decide where you stand by weighing the 2 key rewards and 1 important warning sign
Looking for more CECO Environmental style investment ideas?
If you only focus on CECO Environmental, you risk missing other opportunities with different risk profiles, cash flow setups, and income potential that could balance your portfolio.
- Target potential mispricings by scanning a focused group of high conviction opportunities using the 20 high quality undiscovered gems.
- Strengthen portfolio resilience by filtering for companies with robust finances through the list of solid balance sheet and fundamentals (26 results).
- Build a steadier income stream by comparing yields and payout quality with the 6 dividend fortresses.
Have feedback on this article? Concerned about the content? Get in touch with us directly. Alternatively, email editorial-team@simplywallst.com