


Universal Display (OLED) is back in focus after subsidiary Universal Vapor Jet Corporation launched NovaJet, a commercial system built on its Universal Vapor Jet Printing platform and targeting advanced semiconductor, solar and biomedical manufacturing workflows.
Universal Display’s news hits a stock that has shown a sharp short-term bounce, with a 1-day share price return of 4.29% and a 7-day move of 11.53%. However, momentum comes off a weaker backdrop, where the year-to-date share price return is down 28.23% and the 1-year total shareholder return has fallen 40.16%. This suggests that traders are reassessing growth potential even as longer term holders still sit on sizeable drawdowns.
Compare Universal Display’s NovaJet catalyst with other advanced manufacturing and chip-related plays by scanning our hand-picked 55 AI infrastructure stocks that could be setting up for the next move.
Universal Display’s sharp bounce sits against years of weak total returns and a fresh product launch that could alter the story. Does that mix still leave more upside potential than downside risk for new buyers here?
Most Popular Narrative: 24.2% Undervalued
Against Universal Display’s last close at $87.45, the most followed narrative anchors fair value near $115.37. This frames NovaJet as arriving while the stock trades at a sizeable markdown to that estimate.
A strong balance sheet with about US$855m in cash and investments, operating margin guidance of 34% to 37% and an active capital return program that has returned more than US$238m over the past 12 months alongside a new US$400m buyback authorization, gives Universal Display financial capacity to keep funding OLED and deposition technologies like NovaJet, which can support longer term earnings power across both display and adjacent markets.
See why 28 investors see Universal Display as 24% undervalued.
Result: Fair Value of $115.37 (UNDERVALUED)
Still, revenue guidance leaning toward the lower US$630m to US$670m range, and the drop in OLED material sales to US$66m, could challenge the Universal Display upside story.
Find out about the key risks to this Universal Display narrative.
Another View: What The DCF Model Says
Universal Display screens as undervalued on analyst fair value at $115.37, yet the Simply Wall St DCF model points the other way. On that cash flow view, estimated value sits near $38.52, which implies the recent $87.45 price could already embed generous expectations. Which lens do you trust more?
Before leaning too hard on either signal, it helps to understand how a long range cash flow tool can diverge so sharply from earnings based targets, and what that gap might say about risk if growth, margins or reinvestment do not match analyst assumptions. Look into how the SWS DCF model arrives at its fair value.
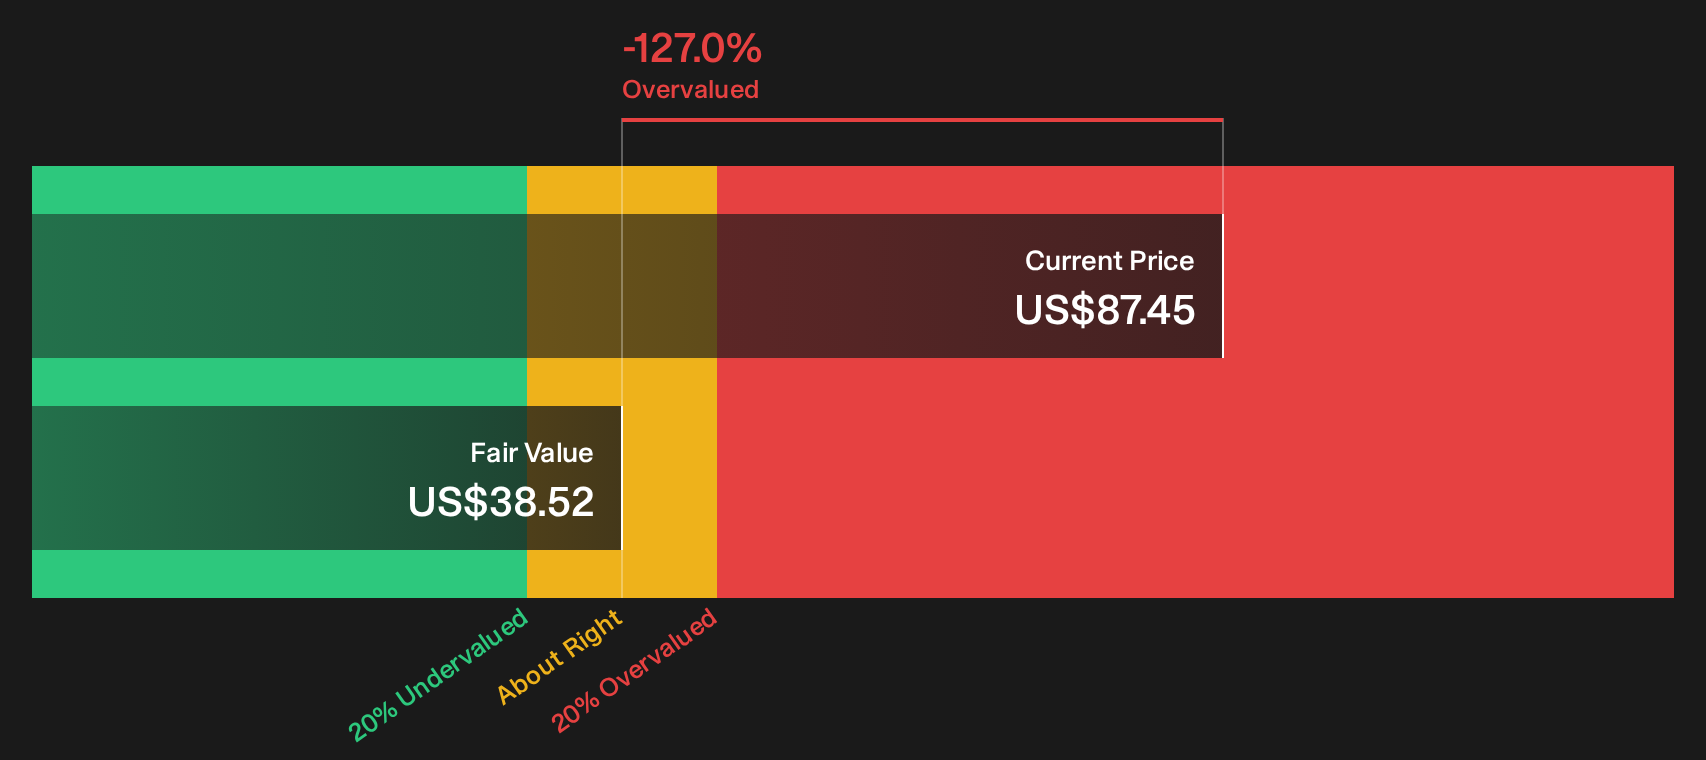
Simply Wall St performs a discounted cash flow (DCF) on every stock in the world every day (check out Universal Display for example). We show the entire calculation in full. You can track the result in your watchlist or portfolio and be alerted when this changes, or use our stock screener to discover 29 high quality undervalued stocks. If you save a screener we even alert you when new companies match - so you never miss a potential opportunity.
Next Steps
Mixed signals can feel uncomfortable, and that is exactly why it helps to move fast and pressure test the numbers yourself. Weigh the concerns against the potential upside, and then ground your own view in the 4 key rewards and 1 important warning sign.
Looking for more Universal Display investment ideas?
If you stop with Universal Display, you risk missing other opportunities that match your goals, so put a shortlist together before your next move.
- Spot potential bargains early by scanning companies that screen as high quality and out of favor using our 29 high quality undervalued stocks.
- Prioritize resilience and sleep-better-at-night positions by filtering for a list of solid balance sheet and fundamentals (26 results) that can handle tougher conditions.
- Get ahead of the crowd by zeroing in on 20 high quality undiscovered gems that already show strong fundamentals before attention fully lands on them.
Have feedback on this article? Concerned about the content? Get in touch with us directly. Alternatively, email editorial-team@simplywallst.com