


Gorman-Rupp (GRC) heads into Friday’s pre-market earnings release with investor focus sharpened by last quarter’s revenue shortfall alongside an EBITDA beat, as well as expectations for 5.1% year-on-year sales growth this time.
Despite the recent pullback, with the 1-day share price return down 5.1% and the 90-day share price return down 14.2%, Gorman-Rupp still carries longer-term momentum, supported by a 1-year total shareholder return of 44.5% and a 3-year total shareholder return of about 2.5x.
Compare Gorman-Rupp’s setup with a curated group of industrials that have resilient balance sheets and consistent execution using our list of solid balance sheet and fundamentals (26 results)
The share price has surged over the past year yet pulled back into this earnings print, while analyst targets and intrinsic estimates sit higher. Where does fair value for Gorman-Rupp really land in that spread?
Price-to-Earnings of 29.7x: Is it justified?
On current numbers, Gorman-Rupp trades on a P/E of 29.7x, which screens as good value against direct peers yet expensive versus both the Machinery industry and an estimated fair P/E level.
The P/E multiple tells you how much investors are paying today for each dollar of earnings, and it is a common lens for established industrial manufacturers with consistent profitability. For Gorman-Rupp, that 29.7x sits below the peer average P/E of 36.1x according to the data, which suggests the market is not assigning the same premium as it does to similar companies in the group.
The same ratio looks less generous when lined up against broader benchmarks. The Machinery industry average P/E sits at 24.8x, so Gorman-Rupp trades on a meaningfully higher earnings multiple than the typical US Machinery stock. The gap is even clearer against the estimated fair P/E of 21.9x. This indicates the market is assigning a richer price than the level that model suggests could eventually be reached if expectations cool.
Explore the SWS fair ratio for Gorman-Rupp.
Result: Price-to-Earnings of 29.7x (OVERVALUED)
Still, the recent share pullback, combined with a richer P/E than the wider Machinery group, leaves Gorman-Rupp exposed if earnings or orders disappoint.
Find out about the key risks to this Gorman-Rupp narrative.
Another View: Gorman-Rupp Through The DCF Lens
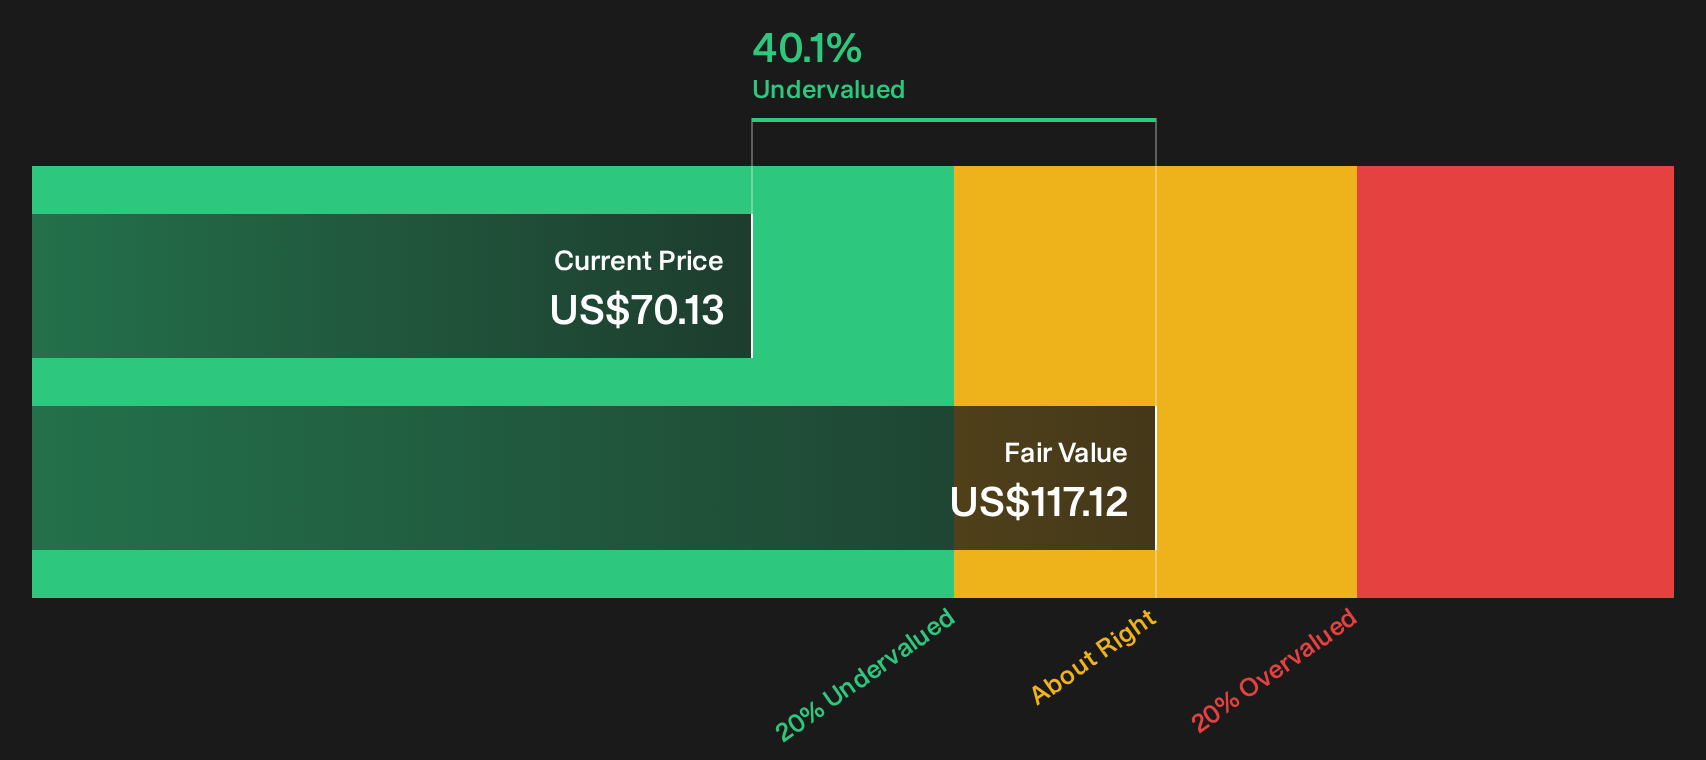
The P/E ratio flags Gorman-Rupp as expensive against the Machinery group and its own fair ratio, yet the SWS DCF model points in the opposite direction. With the share price at $70.13 and a future cash flow value estimate of $117.12, that framework signals undervaluation instead.
This kind of split between earnings multiple and cash flow estimate often reflects different assumptions about how durable margins and growth will be. It raises a simple question for you as an investor: Which set of expectations feels closer to how Gorman-Rupp will actually run its pump business over the coming years?
Look into how the SWS DCF model arrives at its fair value.
Simply Wall St performs a discounted cash flow (DCF) on every stock in the world every day (check out Gorman-Rupp for example). We show the entire calculation in full. You can track the result in your watchlist or portfolio and be alerted when this changes, or use our stock screener to discover 29 high quality undervalued stocks. If you save a screener we even alert you when new companies match - so you never miss a potential opportunity.
Next Steps
Mixed signals on Gorman-Rupp so far. If you want to move quickly and decide where you land, weigh the upside and downside in the 3 key rewards and 2 important warning signs
Looking for more investment ideas beyond Gorman-Rupp?
If Gorman-Rupp has sharpened your thinking on price, quality, and risk, broaden your watchlist with a few targeted stock ideas sourced directly from Simply Wall Street tools.
- Target potential mispricings by scanning companies that combine quality fundamentals with attractive valuations using the 29 high quality undervalued stocks.
- Strengthen your income stream by reviewing payout candidates in the 6 dividend fortresses that pair high yields with resilient profiles.
- Dial down portfolio stress by focusing on stability and balance sheet strength through the 30 resilient stocks with low risk scores.
Have feedback on this article? Concerned about the content? Get in touch with us directly. Alternatively, email editorial-team@simplywallst.com