


AI Jitters, Oil Shocks and a Fed on Hold: What Is Driving NQ
NQ is currently most sensitive to the durability of the AI spending trade, oil prices and interest rates. As of Oct 22, 2026, the Nasdaq Composite fell 2.6% to 26,008.86, its worst session since June, while the S&P 500 dropped 1.21% to 7,663.43, its worst day since July. Semiconductors and AI infrastructure names led the decline. Meta fell nearly 7% after its quarterly results and a 2 for 1 stock split announcement. CoreWeave dropped about 10% on renewed concerns about the cost of capital for debt heavy balance sheets. IBM’s CEO also said on its Oct 21 earnings call that large enterprises are becoming more aware of the true return on their AI spending.
Money rotated rather than leaving the whole market. As of Oct 22, 2026, the Dow Jones Industrial Average was little changed at 52,867.98 and the Russell 2000 edged up 0.11%, which shows risk was being reduced in mega cap growth. The 10 year Treasury yield fell about 19 basis points to roughly 4.95%, Bitcoin slipped below $82,000 and the VIX rose to 19.03.
Geopolitics added pressure. As of Oct 22, 2026, the New York Times reported that the US and Israel have drawn up plans for renewed attacks on Iran after the Nov. 3 midterm elections, and Saudi Arabia said it suffered attacks at Dammam airport and an Aramco oil field. Brent crude traded near $113 per barrel, its highest level since May, and WTI neared $100. Meanwhile, the Fed raised rates by 25 basis points in September to 3.75% to 4.00%, and as of Oct 22, 2026, CME FedWatch showed a hold as the heavy favorite for the Oct 27 to 28 meeting.
What Has the Market Done?
- From March to June, NQ staged a straight-line rally with little to no pullback, reaching new ATHs.
- From June to September, the market entered a consolidation, moving sideways between 31,000 (Daily Level 1) and 29,200 (Daily Level 2).
- In August and September, buyers stepped up their bids at 29,200, and as a result, prices were lifted to new ATHs in October.
- However, this move was short-lived because buyers were not able to accept prices at the ATHs. Consequently, the market quickly fell back below 31,000 and swept down to 29,200 (Daily Level 2).
What to Expect in the Coming Weeks
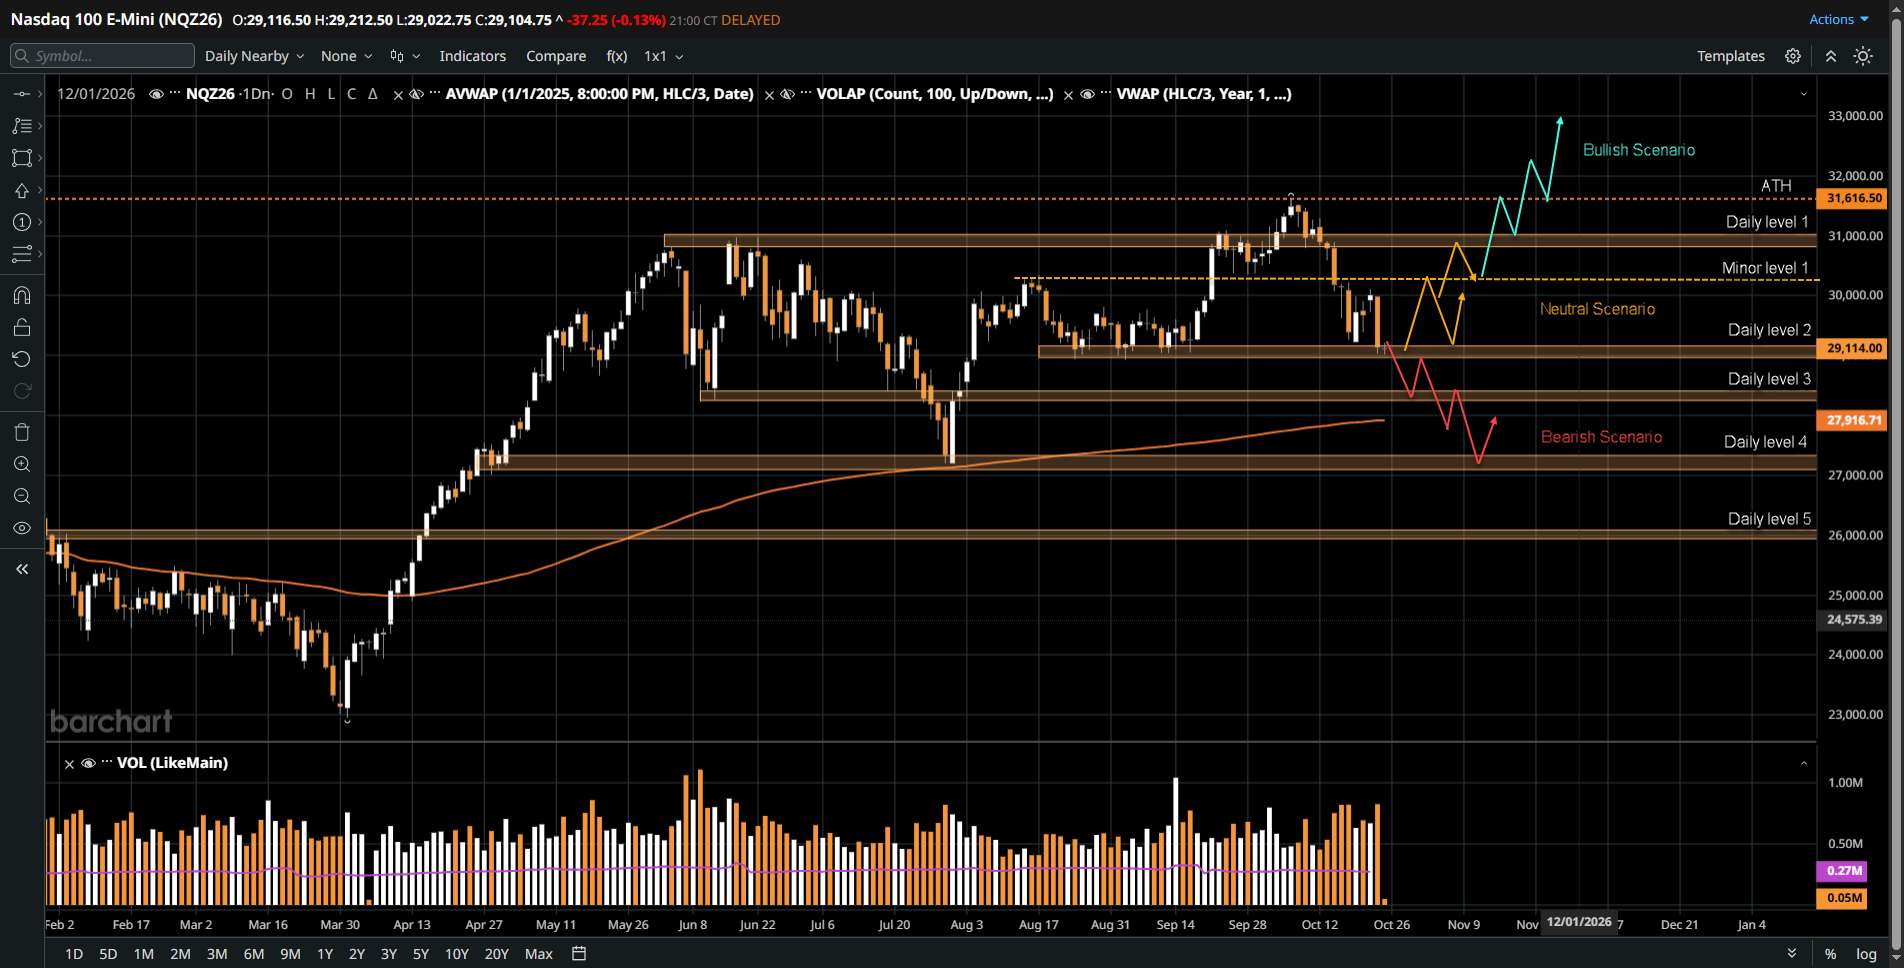
The key level is 29,200 (Daily Level 2). The scenarios below are framed for the next few weeks to a month.
Neutral Scenario
- Prices may rotate two ways between 30,150 (Minor Level 1) and 29,200, with a possible extension on the upside toward 31,000 (Daily Level 1) before responsive sellers offer prices back down.
- A possible supporting condition for this scenario is a Fed hold on Oct 28 with cautious guidance, mixed results from Microsoft, Alphabet and Amazon, and oil holding near current levels without a fresh geopolitical shock.
Bullish Scenario
- If buyers hold above 30,150 (Minor Level 1) after a test up to 31,000 (Daily Level 1) and a pullback to 30,150, a revisit of 31,616.5 (ATH) is possible, and subsequently, new ATHs.
- A possible trigger is strong results and constructive AI capex commentary from Microsoft and Alphabet on Oct 28 and Amazon on Oct 29, alongside a Fed hold and easing Treasury yields that restore confidence in the AI trade.
Bearish Scenario
- If buyers do not defend 29,200, a move down to 28,400 (Daily Level 3) is possible, and subsequently down to 27,300. If buyers do not defend there, a further move down to 26,000 (Daily Level 5) is possible.
- A possible trigger is a disappointing capex or cloud report that revives AI spending concerns, combined with a hawkish Fed surprise or an escalation involving Iran after the Nov. 3 midterms that pushes oil sharply higher.
Conclusion
Technically, 29,200 (Daily Level 2) is the line that separates a rotation inside the range from a deeper unwind toward 28,400 (Daily Level 3). Fundamentally, several catalysts are close together: the Fed decision on Oct 28, Microsoft and Alphabet earnings after the close that same day, Amazon earnings on Oct 29, the Nov. 3 midterm elections, and Nvidia’s report expected in mid November. Watch how price reacts around 29,200 and 30,150 as these events arrive. Do you see buyers defending this level again, or is a deeper test coming? Share your thoughts in the comments.
We built EdgeClear for traders who treat trading as a business. That means low commissions, zero-friction order routing, and free access to EdgeClear Insights—a cloud-based analytics platform that tracks your P&L, discipline, and execution quality in real time. Build your trading business on a foundation that scales with you. Open an Account today.
Disclaimer:
This article is provided for informational and educational purposes only and does not constitute financial, investment, or trading advice. The analysis presented reflects the author’s market observations and opinions at the time of writing and is not a recommendation to buy or sell any futures contract, security, or financial instrument. Futures trading involves significant risk and is not suitable for all market participants. Losses may exceed initial margin deposits, and market conditions can change rapidly.
Any scenarios, levels, or market expectations discussed are hypothetical in nature and are intended solely to illustrate potential market behavior. They do not represent actual trading results and should not be interpreted as guarantees of future performance. Past performance, market behavior, or historical price action are not indicative of future outcomes.
Readers are solely responsible for their own trading decisions and risk management. Always conduct independent research, consider your financial situation and risk tolerance, and consult with a qualified financial professional, if necessary, before engaging in futures or derivatives trading.