


Sempra (SRE) has drawn fresh attention after recent share price moves, with the stock closing at US$84.77. Investors are weighing this against its mixed short term and longer term return profile.
Recent trading hints at a modest shift in sentiment around Sempra, with a 1 day share price return of 1.52% and a 7 day share price return of 3.47% tempering a 90 day share price decline of 8.83%. That near term uptick contrasts with a year to date share price return that is still down 5.51%, even as longer horizons tell a different story, with total shareholder return of 31.54% over three years and 52.85% over five years. This points to a business that has historically rewarded patient holders more than short term traders.
Compare Sempra's recent pullback and long term record against a hand picked group of resilient utilities and infrastructure stocks in the 30 resilient stocks with low risk scores.
Sempra appears to be a solid regulated utility with a long-term track record. However, after the recent bounce from its pullback, investors may want to consider whether the current share price offers sufficient value for that level of quality.
Most Popular Narrative: 14% Undervalued
Sempra's most followed valuation story puts fair value at about $99.03 a share, above the recent $84.77 close. This frames the current pullback as a potential mismatch between price and the long term buildout case.
The US$47.5b five year base capital plan at Oncor, along with US$10b of incremental identified projects tied to ERCOT endorsed upgrades, reliability work and future resiliency filings, keeps the earlier thesis about sustained capital deployment into transmission and distribution assets in place as a driver of long term earnings growth.
See why 25 investors see Sempra as 14% undervalued.
Result: Fair Value of $99.03 (UNDERVALUED)
Still, the whole Sempra narrative can unravel if regulators in California or Texas reduce allowed returns, or if LNG project delays drag on earnings longer than expected.
Find out about the key risks to this Sempra narrative.
Another View: Sempra on Earnings Multiples
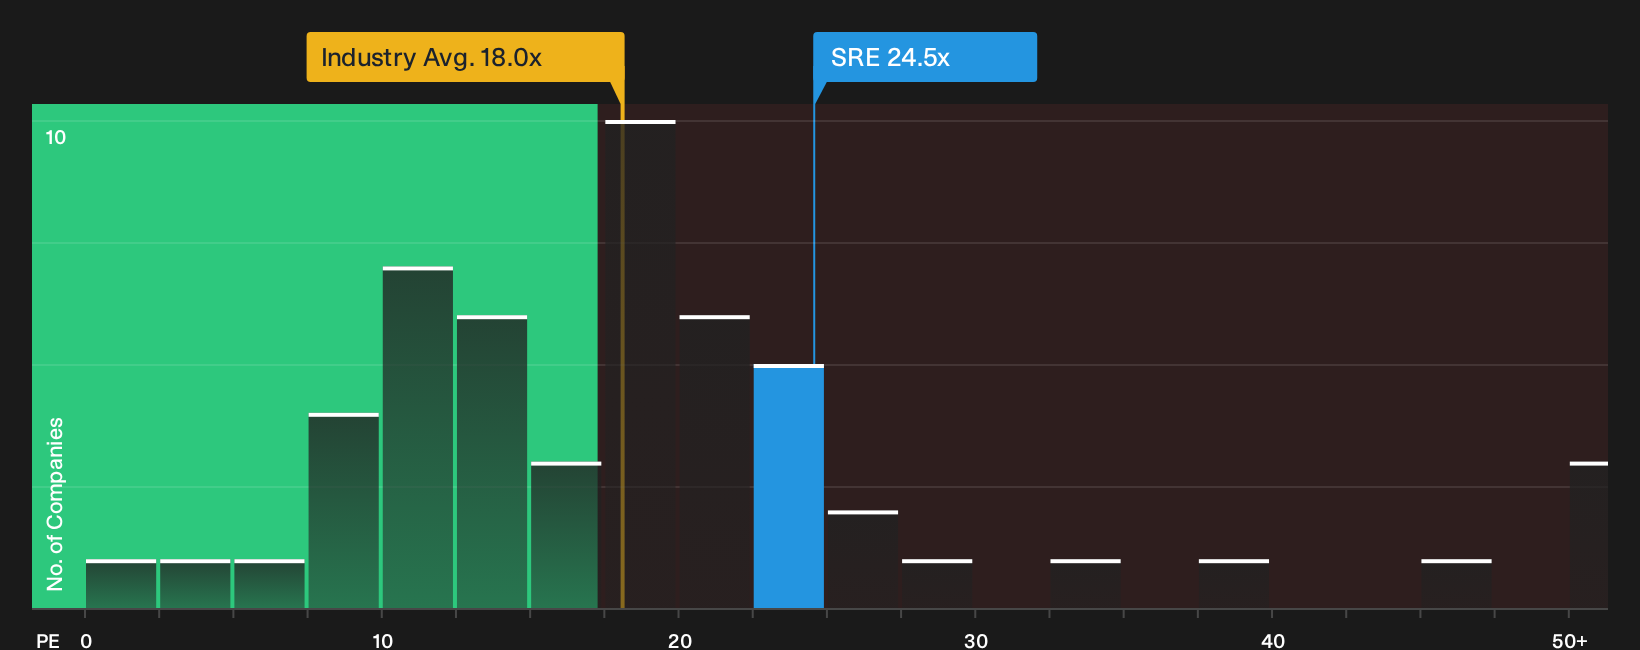
That 14% undervalued story sits awkwardly beside Sempra's current P/E of 24.5x. The wider integrated utilities group trades closer to 18x and direct peers average about 20.5x, while the fair ratio points to 22.5x. For anyone watching entry points, this raises the question of whether there is a cushion in the current price or a valuation squeeze waiting to happen.
To see how those earnings ratios stack up in more detail, and what they might mean for valuation risk, See what the numbers say about this price — find out in our valuation breakdown.
Next Steps
Mixed messages so far on Sempra's story. Act quickly and test the numbers yourself, then weigh the 1 key reward and 2 important warning signs against your own risk tolerance and time horizon.
Looking for more investment ideas beyond Sempra?
If Sempra has you thinking harder about price versus quality, take that momentum and run a quick screen for other opportunities before the next move passes you.
Use these ready made filters to pressure test your watchlist and uncover fresh angles you might have missed.
- Target potential bargains that pair robust fundamentals with appealing valuations through the 29 high quality undervalued stocks.
- Zero in on companies with resilient finances and cleaner balance sheets by scanning the list of solid balance sheet and fundamentals (26 results).
- Hunt for overlooked opportunities with quality metrics that still fly under the radar using the 20 high quality undiscovered gems.
Have feedback on this article? Concerned about the content? Get in touch with us directly. Alternatively, email editorial-team@simplywallst.com