


Over the last 7 days, the United States market has experienced a 1.2% decline, yet it remains up by 11% over the past year with earnings projected to grow by 17% annually. In such fluctuating conditions, identifying stocks that are potentially undervalued can offer investors opportunities to capitalize on assets priced below their estimated value.
Top 10 Undervalued Stocks Based On Cash Flows In The United States
| Name | Current Price | Fair Value (Est) | Discount (Est) |
| Textron (TXT) | $78.04 | $147.32 | 47% |
| Pediatrix Medical Group (MD) | $29.55 | $58.85 | 49.8% |
| Old Second Bancorp (OSBC) | $24.71 | $48.45 | 49% |
| Noah Holdings (NOAH) | $7.01 | $13.22 | 47% |
| Jones Lang LaSalle (JLL) | $312.55 | $610.10 | 48.8% |
| Halliburton (HAL) | $33.19 | $65.52 | 49.3% |
| ConnectOne Bancorp (CNOB) | $32.82 | $64.51 | 49.1% |
| Atlantic Union Bankshares (AUB) | $40.10 | $78.92 | 49.2% |
| Artisan Partners Asset Management (APAM) | $34.40 | $64.60 | 46.7% |
| Amazon.com (AMZN) | $250.38 | $471.23 | 46.9% |
Below we spotlight a couple of our favorites from our exclusive screener.
ConnectOne Bancorp (CNOB)
Overview: ConnectOne Bancorp, Inc. is the bank holding company for ConnectOne Bank, offering commercial banking products and services to small and mid-sized businesses, local professionals, and individuals in the United States, with a market cap of approximately $1.55 billion.
Operations: ConnectOne Bancorp generates revenue through its provision of commercial banking products and services tailored for small and mid-sized businesses, local professionals, and individuals across the United States.
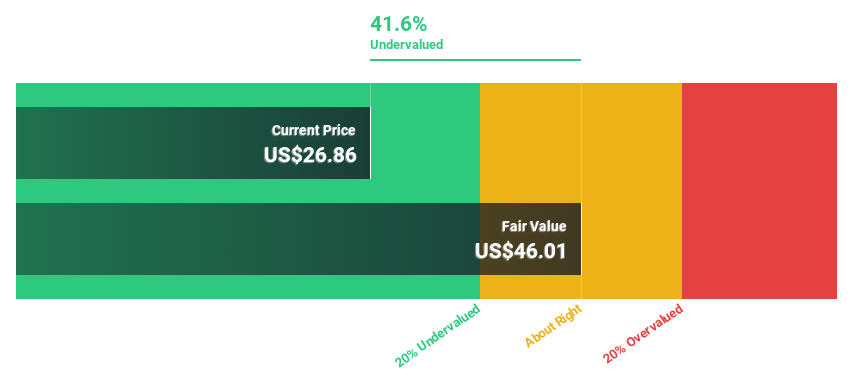
Estimated Discount To Fair Value: 49.1%
ConnectOne Bancorp is trading at $32.82, significantly below its estimated future cash flow value of $64.51, suggesting it may be undervalued based on cash flows. Despite slower revenue growth forecasts compared to the market, earnings are expected to grow annually by 16.4%. Recent financials show strong net interest income but a decline in net income for Q3 2026 compared to last year. The company maintains a reliable dividend and has completed substantial share buybacks.
- Upon reviewing our latest growth report, ConnectOne Bancorp's projected financial performance appears quite optimistic.
- Unlock comprehensive insights into our analysis of ConnectOne Bancorp stock in this financial health report.
Pediatrix Medical Group (MD)
Overview: Pediatrix Medical Group, Inc. provides newborn, maternal-fetal, and pediatric subspecialty care services across the United States and has a market capitalization of approximately $2.23 billion.
Operations: The company generates revenue of approximately $1.95 billion from its healthcare facilities and services segment, which encompasses a range of pediatric and maternal-fetal care services in the United States.
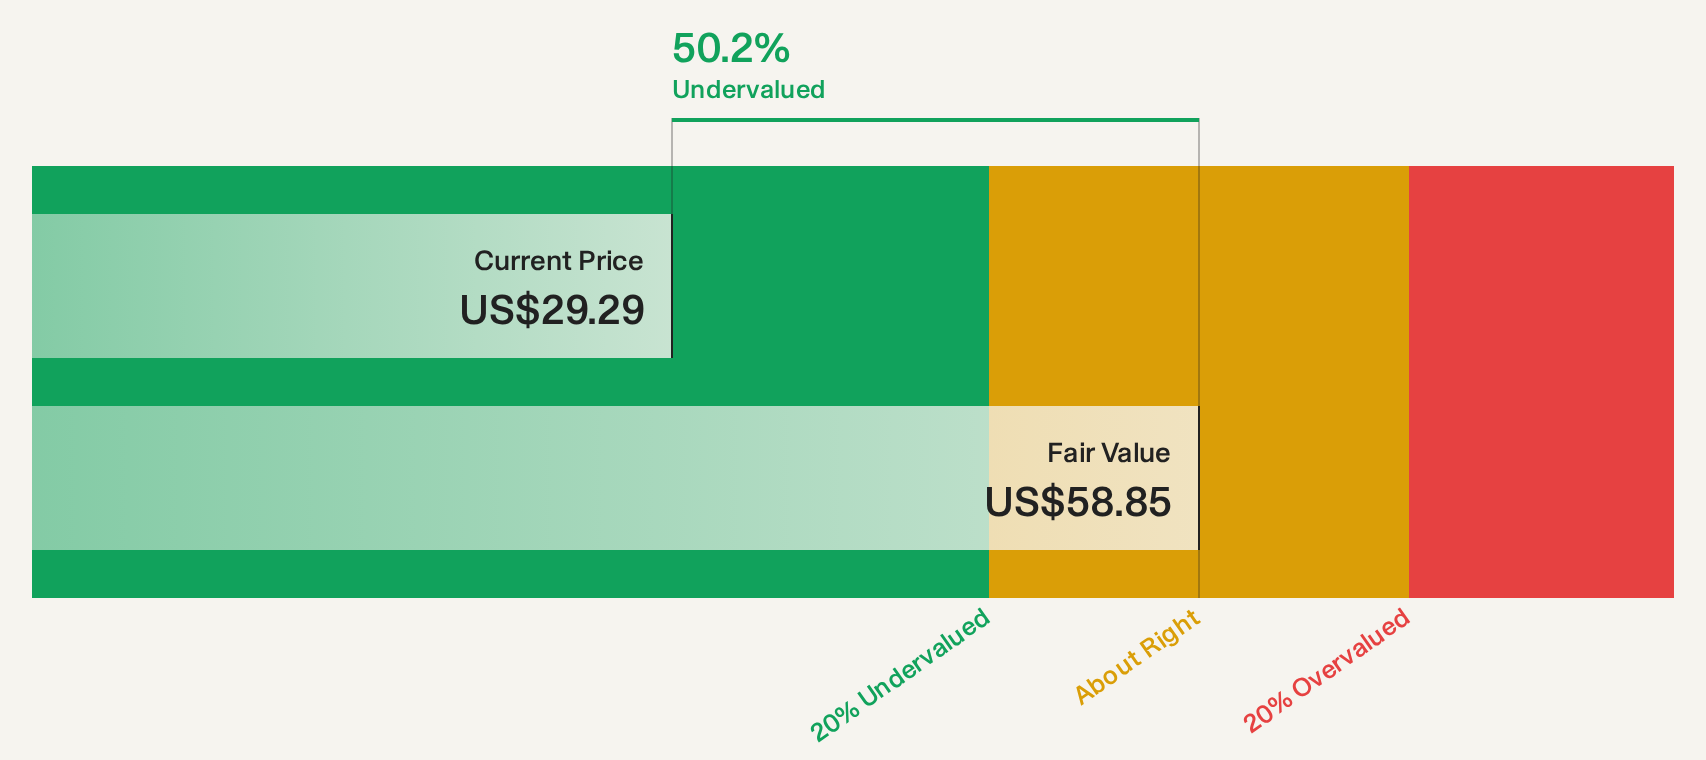
Estimated Discount To Fair Value: 49.8%
Pediatrix Medical Group, trading at $29.55, is considerably below its estimated future cash flow value of $58.85, highlighting potential undervaluation based on cash flows. Despite a modest forecasted earnings growth of 0.6% annually and revenue growth of 3.2% per year—both lagging behind the broader US market—the company has demonstrated solid financial performance with increased sales and net income in recent quarters and completed significant share buybacks totaling $144.59 million recently.
- In light of our recent growth report, it seems possible that Pediatrix Medical Group's financial performance will exceed current levels.
- Take a closer look at Pediatrix Medical Group's balance sheet health here in our report.
Provident Financial Services (PFS)
Overview: Provident Financial Services, Inc. is the bank holding company for Provident Bank, offering a range of banking products and services to individuals, families, and businesses in the United States with a market cap of approximately $2.94 billion.
Operations: The company's revenue is primarily derived from its Traditional Banking and Other Financial Services segment, which generated $894.28 million.
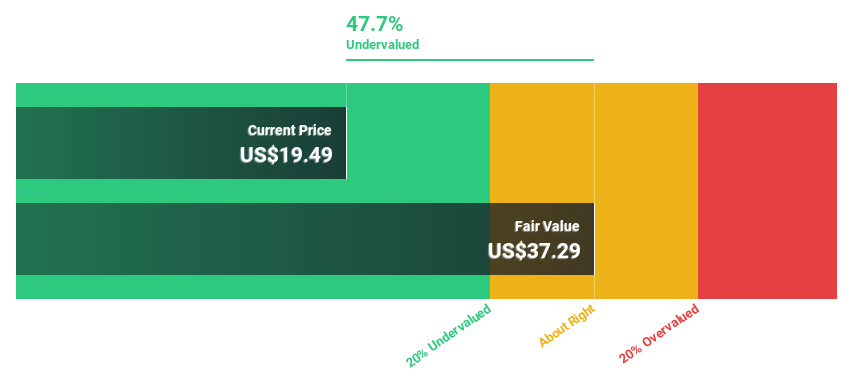
Estimated Discount To Fair Value: 44.4%
Provident Financial Services, priced at $23.12, trades significantly below its estimated future cash flow value of $41.58, suggesting undervaluation based on cash flows. Despite slower projected earnings and revenue growth compared to the US market, the company maintains a reliable 4.15% dividend yield and has completed substantial share buybacks worth $83.21 million since 2021. Recent financial results show increased net income and interest income year-over-year, reinforcing its fiscal stability amidst strategic board expansions and fixed-income offerings totaling $175 million.
- According our earnings growth report, there's an indication that Provident Financial Services might be ready to expand.
- Navigate through the intricacies of Provident Financial Services with our comprehensive financial health report here.
Turning Ideas Into Actions
- Reveal the 95 hidden gems among our Undervalued US Stocks Based On Cash Flows screener with a single click here.
- Got skin in the game with these stocks? Elevate how you manage them by using Simply Wall St's portfolio, where intuitive tools await to help optimize your investment outcomes.
- Simply Wall St is your key to unlocking global market trends, a free user-friendly app for forward-thinking investors.
Want To Explore Some Alternatives?
- Explore high-performing small cap companies that haven't yet garnered significant analyst attention.
- Diversify your portfolio with solid dividend payers offering reliable income streams to weather potential market turbulence.
- Fuel your portfolio with companies showing strong growth potential, backed by optimistic outlooks both from analysts and management.
This article by Simply Wall St is general in nature. We provide commentary based on historical data and analyst forecasts only using an unbiased methodology and our articles are not intended to be financial advice. It does not constitute a recommendation to buy or sell any stock, and does not take account of your objectives, or your financial situation. We aim to bring you long-term focused analysis driven by fundamental data. Note that our analysis may not factor in the latest price-sensitive company announcements or qualitative material. Simply Wall St has no position in any stocks mentioned.
Have feedback on this article? Concerned about the content? Get in touch with us directly. Alternatively, email editorial-team@simplywallst.com