


AT&T has pulled back over the past month after a longer stretch of gains. That mix of returns now raises a straightforward question for investors who care most about earnings: is today’s share price in line with what the business is actually earning?
- AT&T has delivered a 74.8% gain over the past 3 years, which puts real weight on whether the current valuation is still grounded in its underlying earnings power.
- Management’s higher long term earnings outlook and focus on fiber and wireless connectivity can influence how much profit growth, margin durability and capital intensity investors build into their models.
- Your read on AT&T is one view; the desks covering it have another. See what analysts think AT&T's shares could be worth.
The issue now is whether the recent price, after that multi year run and new earnings ambitions, is adequately supported by AT&T's current and expected earnings.
If you want more context on where AT&T fits today, a focused stock screen built around 29 high quality undervalued stocks is a clean way to broaden your research, starting from this earnings question.
Is AT&T Still Cheap on Earnings?
P/E fits AT&T because investors focus heavily on what its connectivity network can earn after the big build costs are already in the ground.
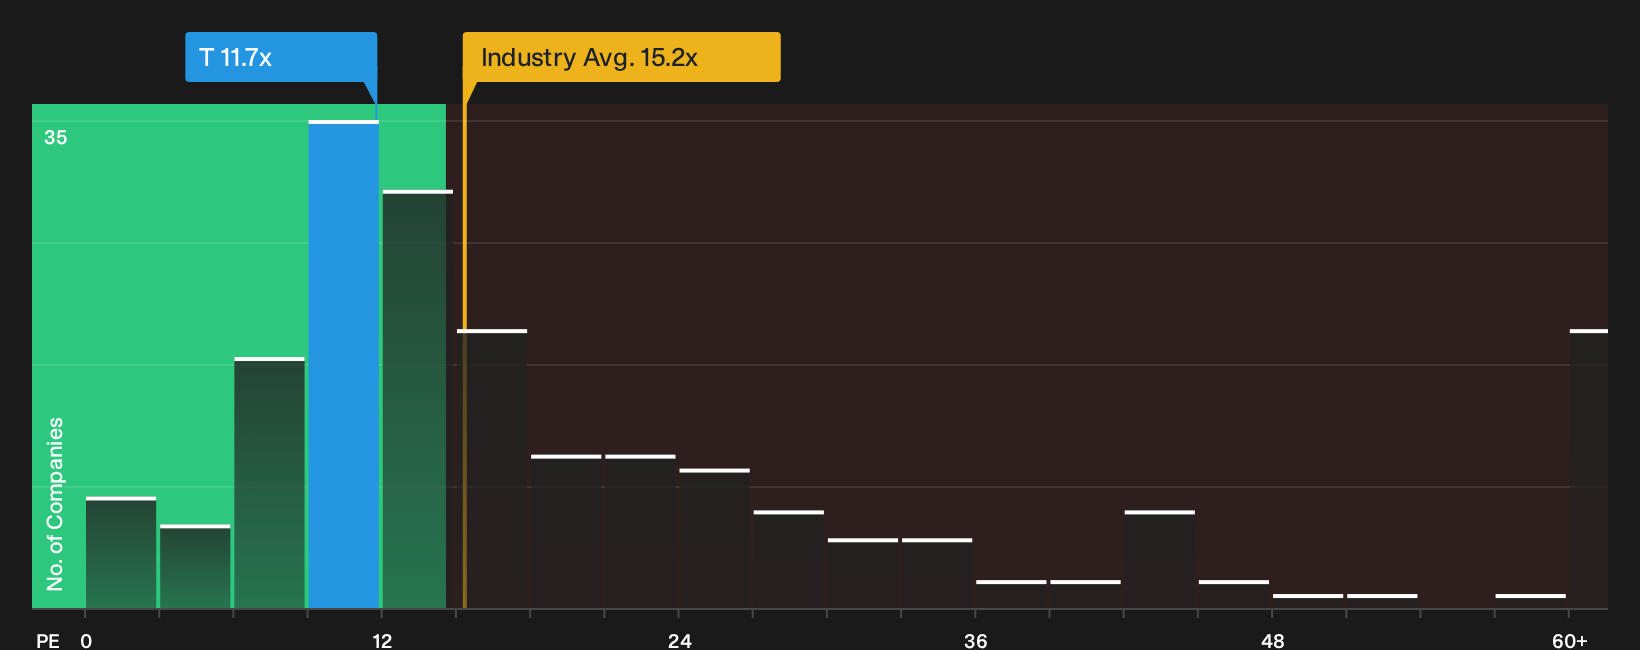
The stock trades on a P/E of 11.7x, very close to both the telecom sector average of 15.2x and the peer group at 11.9x. That clustering indicates that the market is valuing AT&T’s current earnings stream in the same general ballpark as comparable telecom businesses, rather than assigning it a clear premium or discount on simple sector and peer screens.
A more tailored fair-value lens that blends AT&T’s growth profile, margins, scale and risk suggests the multiple could be higher, so today’s 11.7x screens as undervalued on that framework. Because management has lifted its 2026 earnings outlook as fiber and wireless volumes build, the current P/E still prices the stock below what this model implies could be justified if those targets are met. Explore the numbers behind AT&T's P/E valuation.
The AT&T Narrative: What Would Justify Today's Price?
AT&T's Simply Wall St Narratives pick up where the valuation puzzle leaves off, spelling out which future paths for growth, profitability and earnings would need to play out for the stock to be worth materially more or materially less than today’s price on the Community page. Instead of stopping at a single output from a ratio or model, these narratives describe the future that figure relies on so you can watch how AT&T's actual progress lines up over time.
Community views on AT&T split between those who see the fiber plan as underappreciated and those who think the capital load already looks fully reflected.
Bull case: 20% undervalued
"The current valuation suggests the market is cautious that AT&T’s fiber led convergence, expected cost savings of roughly $6b from legacy networks, and planned approximately $45b in shareholder returns over three years will fully translate into a higher share price..."
Discover why this Narrative puts AT&T at 20% undervalued.
Bear case: 9% overvalued
"The current valuation implies that AT&T's share price already reflects guided double digit EPS growth through 2028, disciplined capital returns of $45 billion over three years, and sustained operating leverage from Advanced Connectivity, leaving limited room for disappointment..."
Explore why this Narrative puts AT&T at 9% overvalued.
Before acting on AT&T's valuation, there is one more angle to check
Price and earnings only tell part of the story for AT&T, because Simply Wall St’s broader review has also surfaced specific risk checks that could influence how you weigh the whole picture. Take a closer look at 3 warning signs before settling on a valuation.
Have feedback on this article? Concerned about the content? Get in touch with us directly. Alternatively, email editorial-team@simplywallst.com