


Apollo Global Management (APO) has agreed to invest US$1.34 billion alongside UDR in a new joint venture that will acquire a two-thirds stake in a US$2 billion multifamily portfolio spanning more than 7,000 apartments.
Apollo Global Management’s latest joint venture comes after a choppy year for the stock, with the share price down 21.68% year to date, even though the three year total shareholder return of 48.44% remains firmly positive.
The 1 day share price return of 2.81% and 7 day gain of 2.65% suggest that investors are responding positively to recent deals in multifamily housing, professional sports and leisure. However, the 30 day and 90 day share price returns, down 7.51% and 6.35%, respectively, indicate that momentum has not fully rebuilt.
Spot opportunities alongside Apollo Global Management in income focused alternatives by scanning our hand picked 29 high quality undervalued stocks that combine quality fundamentals with discounted valuations.Apollo Global Management is leaning harder into income focused real assets just as the share price has lagged. Does that gap still tilt the risk reward balance toward buyers, or has the easy upside already gone?
Preferred P/E of 35.9x: Is it justified for Apollo Global Management?
Apollo Global Management trades at a P/E ratio of 35.9x, which sets a relatively rich bar for earnings compared with both peers and an internal fair value benchmark, even with the share price at $114.83.
The P/E multiple measures how much investors are currently paying for each dollar of net profit. A higher figure tends to reflect strong expectations for future earnings power or perceived resilience. For a diversified alternatives group that leans on fees, carried interest and balance sheet investing across credit, private equity and real assets, the P/E often captures how much faith the market has in that earnings stream through cycles.
For Apollo Global Management, the 35.9x P/E is described as attractive relative to a peer average of 49.2x, which suggests investors are paying less for each dollar of earnings than for comparable diversified financial stocks. At the same time, the ratio is flagged as expensive against both the broader US Diversified Financial industry average of 17.7x and an estimated fair P/E of 22.3x. This is a level the market could eventually gravitate toward if sentiment cools or earnings forecasts are revised.
Explore the SWS fair ratio for Apollo Global Management.
Result: Price-to-earnings of 35.9x (OVERVALUED)
Still, Apollo Global Management faces clear risks if fee related earnings soften, or if sentiment toward diversified financial groups resets closer to the broader industry P/E.
Find out about the key risks to this Apollo Global Management narrative.
Another View: SWS DCF model points to upside
The earlier P/E work paints Apollo Global Management as expensive relative to a fair ratio of 22.3x, yet the SWS DCF model points the other way. At $114.83, the stock sits below an estimated future cash flow value of $162.26, suggesting investors are not fully pricing in those projected earnings yet. That gap might represent compensation for risk, or it could be a window that closes if the cash flows arrive as expected.
Look into how the SWS DCF model arrives at its fair value.
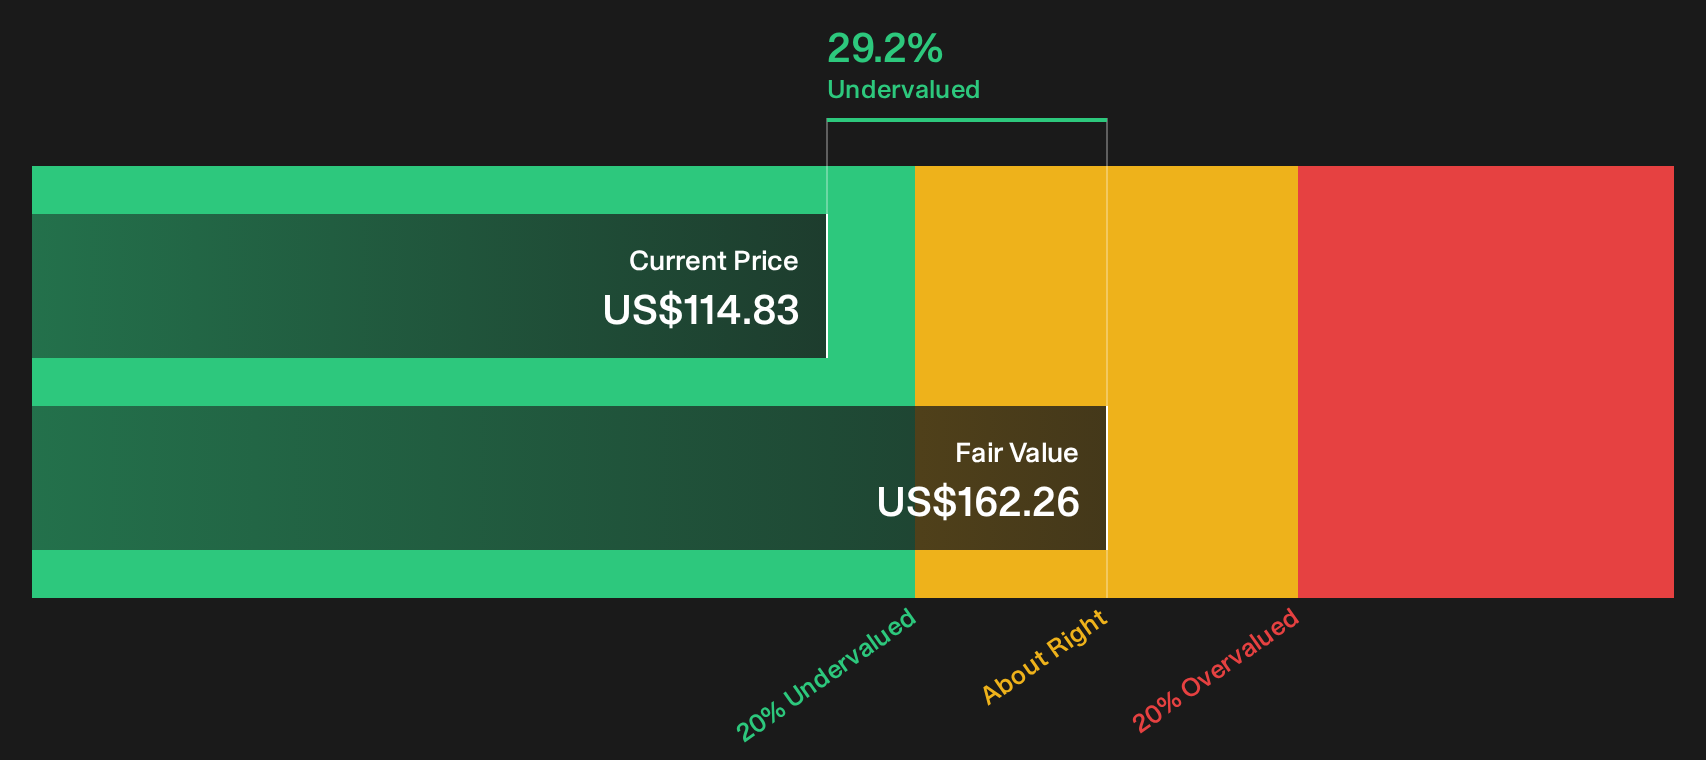
Simply Wall St performs a discounted cash flow (DCF) on every stock in the world every day (check out Apollo Global Management for example). We show the entire calculation in full. You can track the result in your watchlist or portfolio and be alerted when this changes, or use our stock screener to discover 29 high quality undervalued stocks. If you save a screener we even alert you when new companies match - so you never miss a potential opportunity.
Next Steps
Mixed signals on Apollo Global Management so far. With one or more risks on the table and also one or more rewards in play, move quickly and weigh both sides for yourself, starting with the 3 key rewards and 2 important warning signs.
Looking for more investment ideas beyond Apollo Global Management?
If Apollo Global Management has your attention, do not stop here. Use these focused screeners to uncover other potential candidates before the crowd gets there.
- Target dependable income by scanning high yield opportunities that pass quality checks through the 6 dividend fortresses.
- Hunt for mispriced quality by running your filters across the 20 high quality undiscovered gems.
- Prioritise resilience first by searching for businesses with strong finances in the list of solid balance sheet and fundamentals (26 results).
Have feedback on this article? Concerned about the content? Get in touch with us directly. Alternatively, email editorial-team@simplywallst.com