


NOF (TSE:4403) drew fresh attention after recent price moves left the shares about 10.1% higher over the past month, even though the year-to-date performance remains down 5.4%.
Recent trading hints at improving sentiment toward NOF, with a 30‑day share price return of 10.15% taking the stock to ¥2,838.5, even though the year to date share price return is still down 5.38%, while the 5‑year total shareholder return sits at 64.91%.
Scan how NOF stacks up against other chemicals and materials players by reviewing a curated group of list of solid balance sheet and fundamentals (23 results) in the same market.
NOF has a broad chemicals and healthcare platform and a share price that just moved sharply higher over 30 days. The real tension is whether that solid backdrop still leaves the stock on offer today.
Price-to-Earnings of 16x: Is it justified for NOF?
On earnings, NOF trades on a P/E of 16x, which lines up with a share price of ¥2,838.5 and suggests investors are paying a premium to the broader Japanese chemicals sector.
The P/E ratio compares the current share price with earnings per share and gives a quick read on how much you are paying for each unit of profit. For a diversified chemicals and healthcare group like NOF, earnings are a key anchor because profit trends and cash generation underpin everything from reinvestment capacity to dividends.
Recent data points to 16% earnings growth over the past year and 6.5% per year over the past 5 years, with current net profit margins of 14.6% compared with 14.2% a year earlier. That kind of profile can help explain why the market is willing to pay more than the sector average. Even so, the stock trades on a higher P/E than the estimated fair level of 14.8x, which suggests some investors may be pricing in richer profitability or resilience than the regression based fair ratio implies.
Against direct peers, the picture is slightly different. NOF's P/E of 16x is higher than the JP chemicals industry average of 12.6x, so the stock is more expensive than the typical sector listing. Yet the same multiple screens cheaper than the peer group average of 19.9x, which signals that while the broader chemicals peer set trades at even steeper earnings multiples, the regression based fair P/E of 14.8x suggests valuation could drift closer to that lower reference point if sentiment cools.
Explore the SWS fair ratio for NOF.
Result: Price-to-Earnings of 16x (OVERVALUED).
Still, the NOF story can change quickly if chemicals demand softens or if pharmaceutical and medical earnings fail to keep pace with the current P/E.
Find out about the key risks to this NOF narrative.
Another View: What NOF's Cash Flows Say
The earnings multiple paints NOF as slightly expensive, yet the SWS DCF model points in the other direction. On that framework, the shares at ¥2,838.5 sit below an estimated future cash flow value of ¥3,542.37, which frames the current price as undervalued. Which signal do you trust more?
Investors who rely heavily on cash generation might lean toward the DCF outcome, while those focused on earnings comparables may stay cautious until pricing or forecasts shift enough to narrow that gap in views, particularly if sector sentiment changes quickly as new data emerges. Look into how the SWS DCF model arrives at its fair value.
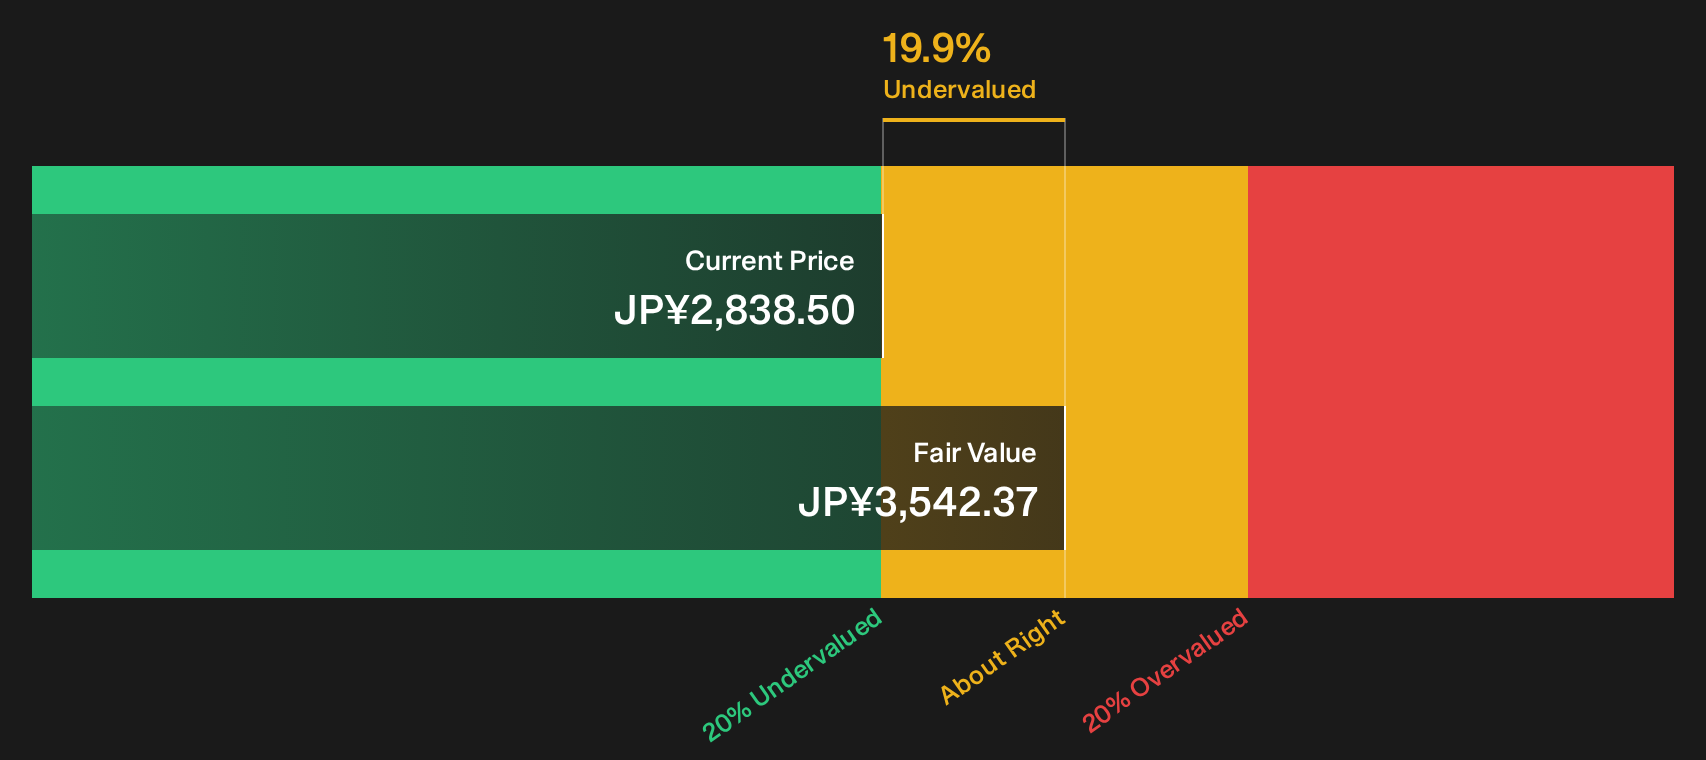
Simply Wall St performs a discounted cash flow (DCF) on every stock in the world every day (check out NOF for example). We show the entire calculation in full. You can track the result in your watchlist or portfolio and be alerted when this changes, or use our stock screener to discover 14 high quality undervalued stocks. If you save a screener we even alert you when new companies match - so you never miss a potential opportunity.
Next Steps
Opinion on NOF is finely balanced right now, which makes this a useful moment to move quickly, test the numbers yourself and decide where you stand. To see why some investors are still optimistic, take a closer look at the 5 key rewards.
Looking for more investment ideas beyond NOF?
Do not stop with a single stock when the wider market is full of companies with different strengths, risk profiles and income potential waiting to be assessed.
- Target potential mispriced opportunities by scanning a curated set of businesses that combine quality fundamentals with attractive valuations through the 14 high quality undervalued stocks.
- Strengthen the income side of your portfolio by reviewing higher yielding opportunities that aim to balance payout and resilience using the 29 dividend fortresses.
- Dial down portfolio risk by focusing on companies that pair sturdier finances with steadier risk profiles via the 22 resilient stocks with low risk scores.
Have feedback on this article? Concerned about the content? Get in touch with us directly. Alternatively, email editorial-team@simplywallst.com