


Axogen (AXGN) has drawn fresh attention after recent trading swings left the share price at US$38.06. Investors are now weighing mixed recent returns against stronger multi year performance and the company’s peripheral nerve repair focus.
Recent trading has been choppy for Axogen, with a 1 day share price return of 3.76% and a 7 day gain of 9.94% following a 30 day share price decline of 12.28%. The year to date share price return of 22.77% sits alongside a 1 year total shareholder return of 109.47% and a 3 year total shareholder return that is roughly 9x the starting level, highlighting stronger performance over longer periods even as short term sentiment resets.
Scan beyond Axogen and line up other healthcare businesses showing strong recent momentum with financially grounded profiles using this curated 21 high quality undiscovered gems as a starting list.
Bulls point to Axogen’s sharp multi year gains and revenue and net income growth, while bears focus on a loss making profile and recent pullback. Which side does today’s valuation actually lean toward?
Most Popular Narrative: 29% Undervalued
On Simply Wall St, the most followed Axogen narrative places fair value at $53.22 compared with the latest close at $38.06. The story leans toward underpricing and focuses heavily on how execution and guidance could support that view.
Broad-based adoption of Axogen's nerve care algorithm across multiple markets (extremities, oral maxillofacial, breast) and strong momentum in activating high-potential accounts indicate that the addressable market for nerve repair may be substantially underpenetrated, with significant room for further revenue growth as awareness and adoption change over time.
See why 8 investors see Axogen as 28% undervalued.
Result: Fair Value of $53.22 (UNDERVALUED)
Still, Axogen’s dependence on a single biologic graft and ongoing Biologics License Application uncertainty could quickly reverse this underpricing story if outcomes disappoint.
Find out about the key risks to this Axogen narrative.
Another View: Axogen Looks Expensive On Sales
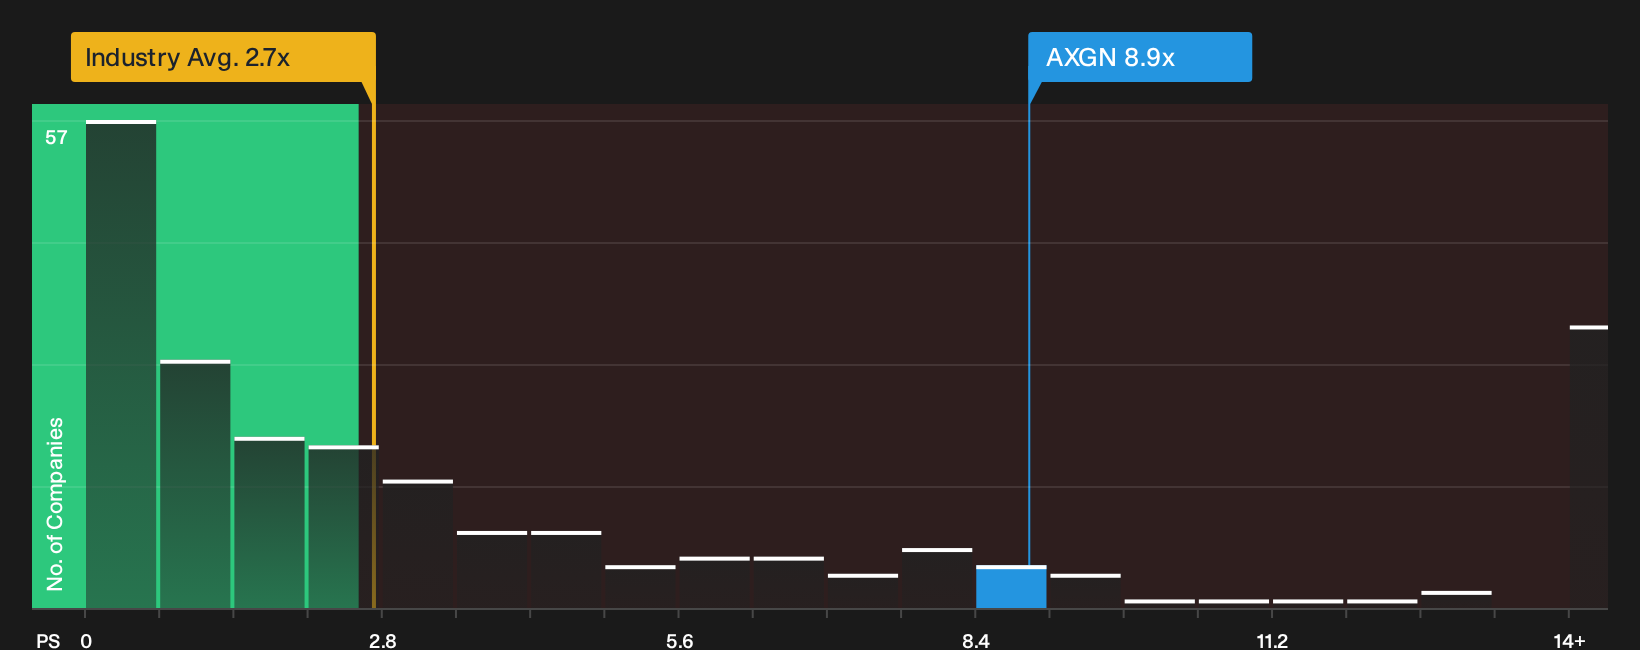
DCF work on Axogen points to a discount to estimated fair value, yet the simple P/S check tells a different story. The stock trades at 8.9x sales, compared with a fair ratio of 5.9x, the peer average of 7.7x and the wider US Medical Equipment group at 2.7x. That gap raises the question of whether investors are already paying up for a lot of future success.
Before leaning too hard on either approach, it is worth seeing what the numbers behind this P/S view imply for upside risk and downside protection, which you can unpack further in the See what the numbers say about this price — find out in our valuation breakdown..
Next Steps
Mixed signals on Axogen so far, with powerful long term gains sitting next to valuation questions and execution risks. Move quickly and review the underlying data yourself to decide how that trade off sits with your goals and time horizon, then pressure test your thinking with the 3 key rewards and 1 important warning sign.
Looking for more Axogen sized ideas?
If Axogen has you thinking harder about where to deploy capital next, do not stop here. Broader research now could be the difference between catching the next opportunity early or watching it pass by.
- Target resilient balance sheets and steadier financial profiles by building your own shortlist with this focused list of solid balance sheet and fundamentals (24 results).
- Hunt for quality at a discount by scanning companies that pair fundamentals with attractive pricing through the curated 29 high quality undervalued stocks.
- Prioritize capital preservation and sleep better at night by filtering for stocks with lower risk profiles using the dedicated 30 resilient stocks with low risk scores.
Have feedback on this article? Concerned about the content? Get in touch with us directly. Alternatively, email editorial-team@simplywallst.com