


Erie Indemnity (ERIE) has drawn fresh attention after recent trading left the shares at US$253.52, with investors weighing its role as managing attorney-in-fact alongside a mixed pattern of recent total returns.
Recent trading tells a mixed story. The 1 month share price return of 13.76% hints at improving momentum from short term buyers, yet the share price is still down 8.74% year to date, and the 1 year total shareholder return has declined 21.36%. This leaves Erie Indemnity looking like a longer term underperformer despite the latest bounce.
Spot shifting sentiment around Erie Indemnity by comparing its recent swings with a hand picked group of 28 high quality undervalued stocks that also pair balance sheet strength with solid cash flows.
Erie Indemnity looks like a solid fee based insurer services business, yet the share price just bounced after a tough year. Are investors now paying a fair price for that quality, or stretching for it?
Price-to-Earnings of 23x: Is it justified?
Erie Indemnity trades on a P/E of 23x, which leaves the stock looking expensive compared to both its insurance peers and the wider US market.
The P/E ratio compares the current share price with earnings per share and gives a snapshot of how much investors are willing to pay for each dollar of profit. For a fee based insurance services group like Erie Indemnity, that multiple often reflects views on the durability of fee income, the quality of underwriting services, and how steady those profits might be through the cycle.
High quality earnings, a Return on Equity of 23.4% and an 18.3% per year earnings growth rate over the past 5 years point to a business that has produced strong profitability over time. At the same time, earnings declined 7.7% over the past year and net profit margins eased from 15.7% to 14%, which suggests the recent profit trend has softened rather than accelerated.
The gap with peers is wide. Management is working with a P/E of 23x, while the US Insurance industry average sits at 11.1x and the peer group sits near 12.8x. That premium implies investors are paying much more than the sector for each dollar of Erie Indemnity earnings, even though recent performance and forecasts carry several unknowns.
See what the numbers say about this price — find out in our valuation breakdown.
Result: Price-to-Earnings of 23x (OVERVALUED)
Still, the recent 1 year total return decline of 21.36% and the softer earnings trend mean any stumble in Erie Indemnity fee income or underwriting services could quickly pressure that premium.
Find out about the key risks to this Erie Indemnity narrative.
Another View: SWS DCF fair value for Erie Indemnity
The P/E screen paints Erie Indemnity as expensive, yet the SWS DCF model points a little the other way. With the shares at $253.52 and the fair value estimate at $262.74, the stock sits about 3.5% below that cash flow based mark. Which lens should carry more weight for you?
Look into how the SWS DCF model arrives at its fair value.
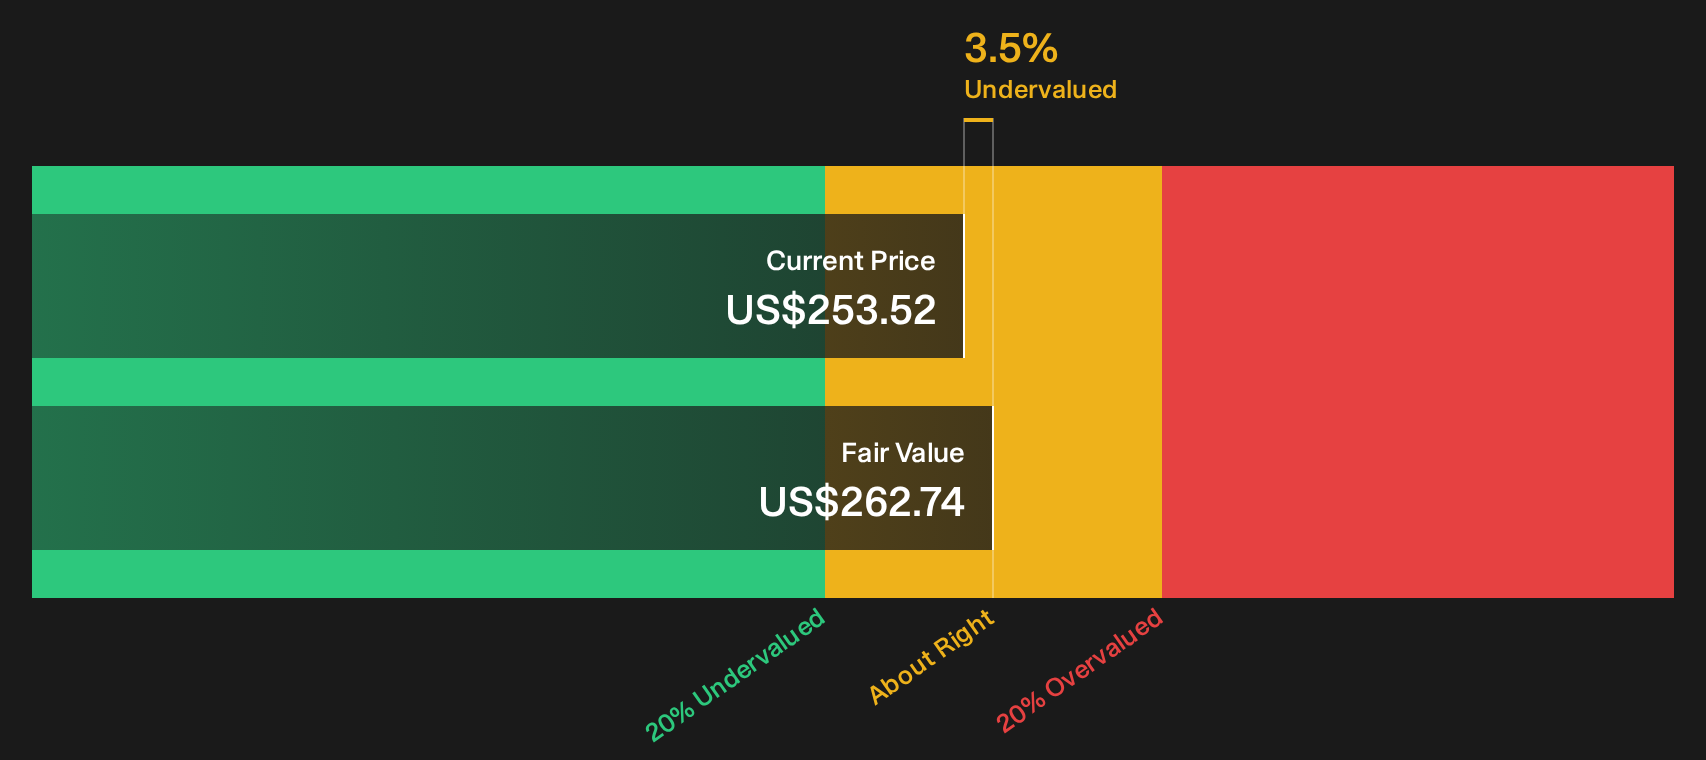
Simply Wall St performs a discounted cash flow (DCF) on every stock in the world every day (check out Erie Indemnity for example). We show the entire calculation in full. You can track the result in your watchlist or portfolio and be alerted when this changes, or use our stock screener to discover 28 high quality undervalued stocks. If you save a screener we even alert you when new companies match - so you never miss a potential opportunity.
Next Steps
Sentiment around Erie Indemnity is clearly split. That is exactly why you should move fast, pull up the key metrics, and pressure test the thesis yourself. To see which positives are catching attention, review the 2 key rewards
Looking for more Erie Indemnity sized investment ideas?
If Erie Indemnity has you rethinking what you own, do not stop here. Broaden your watchlist now and let stronger ideas compete for space.
- Target steadier compounding by reviewing a curated mix of resilient companies with lower risk profiles through the 30 resilient stocks with low risk scores.
- Hunt for quality at a reasonable price by scanning cash rich, fundamentally sound opportunities with the 21 high quality undiscovered gems.
- Build a sturdier core portfolio by focusing on companies with healthy finances using a list of solid balance sheet and fundamentals (24 results).
Have feedback on this article? Concerned about the content? Get in touch with us directly. Alternatively, email editorial-team@simplywallst.com