


CNA Financial earnings setup for Q3 2026
CNA Financial (CNA) heads into its Q3 2026 report with expectations for lower year over year earnings, even as revenue is projected higher, and a negative Earnings ESP is shaping pre-results sentiment.
Recent trading has been choppy for CNA Financial, with the share price up 5.42% over the past month but down 12.37% over the last 90 days, while a 16.15% 1 year total shareholder return and 57.72% 3 year total shareholder return point to stronger longer term momentum despite cautious sentiment around the upcoming earnings release.
Scan how CNA Financial compares with a hand-picked 30 resilient stocks with low risk scores that has held up when sentiment turns cautious around earnings season.
Bulls view CNA Financial’s recent pullback as an opportunity to buy a potential long-term compounder, while bears highlight cautious earnings expectations and analyst pessimism. Which story does the current valuation actually support?
Price-to-Earnings of 10.6x: Is it justified for CNA Financial?
On simple headline numbers, CNA Financial trades on a P/E of 10.6x, which screens as cheap compared with both its peers and the wider US insurance sector at the current $48.47 share price.
The P/E ratio compares what investors pay today for each dollar of current earnings. For an insurer like CNA Financial, where profitability and underwriting discipline tend to move more slowly than in high growth sectors, this metric often acts as a quick check on how the market is weighing steady earnings against perceived risks.
CNA is flagged as good value on several fronts. The 10.6x P/E sits below the peer average of 15.8x, and it also comes in lower than the US insurance industry average of 11.1x. That gap suggests the market is applying a discount to CNA Financial despite high quality earnings, 41% earnings growth over the past year, and profit growth ahead of the broader insurance industry over the same period.
The valuation work also indicates that a P/E of 10.6x is in line with an estimated fair P/E of 10.6x. This points to a market price that already reflects the regression based fair multiple investors often migrate toward over time.
Explore the SWS fair ratio for CNA Financial.
Result: Price-to-Earnings of 10.6x (UNDERVALUED)
Still, short term risks for CNA Financial include the current discount to a US$45 analyst target, as well as any disappointment around earnings that reinforces that caution.
Find out about the key risks to this CNA Financial narrative.
Another view on CNA Financial’s value
The first check on CNA Financial focused on its 10.6x P/E and how that stacks up against peers and a fair ratio of 10.6x. That lens says the shares are cheap but roughly in line with where the market could settle under normal conditions.
A very different signal comes from our DCF model, which estimates future cash flow value at $85.21 per share versus the current $48.47 price. That gap points to a stock that screens as materially undervalued on cash flows even though the earnings multiple already looks reasonable. Which lens do you put more weight on when those two stories diverge this far?
Look into how the SWS DCF model arrives at its fair value.
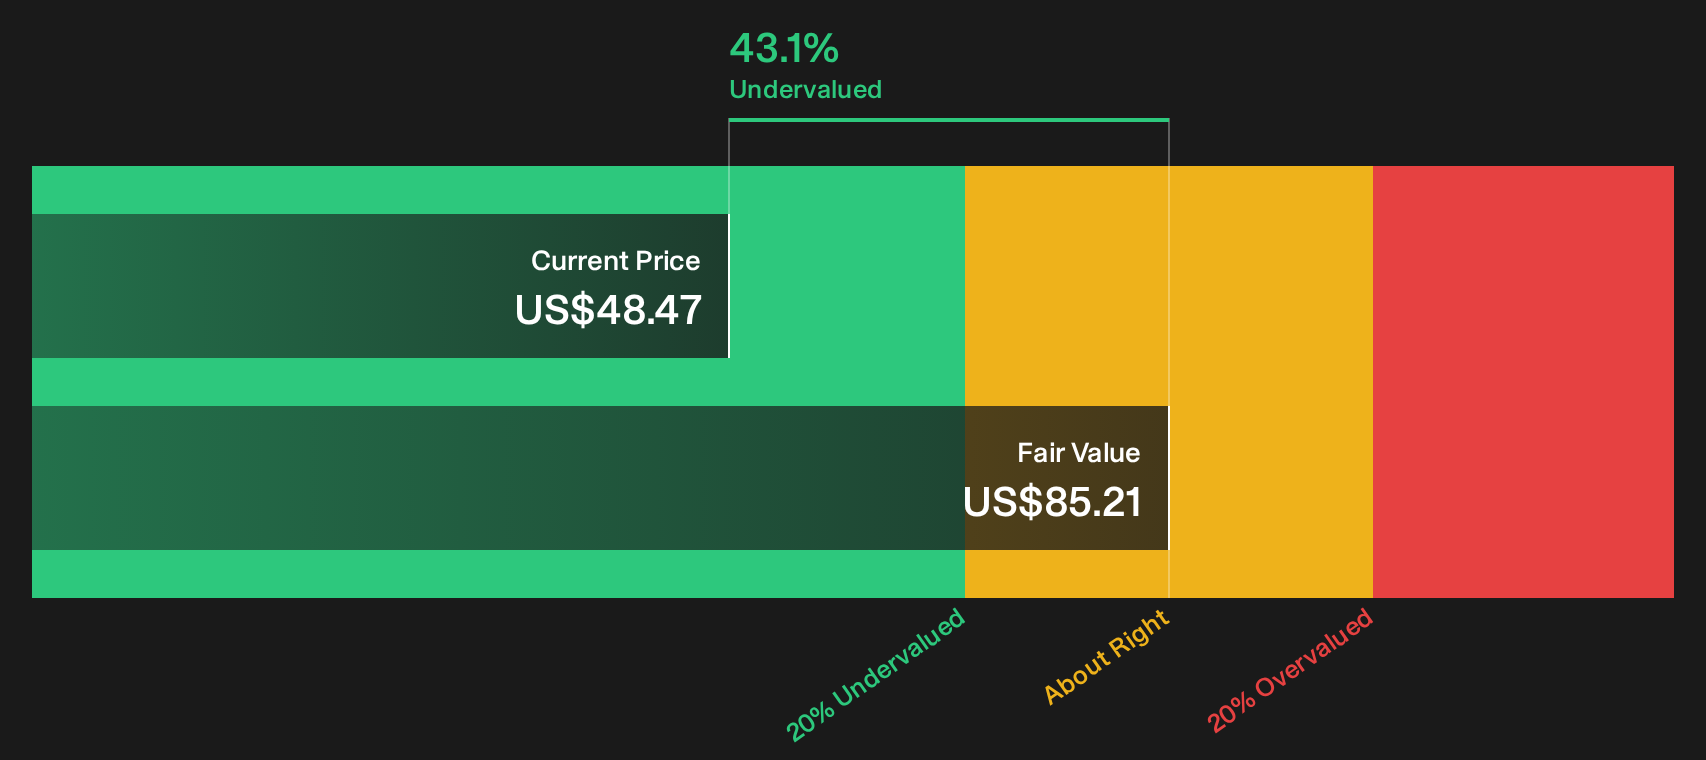
Simply Wall St performs a discounted cash flow (DCF) on every stock in the world every day (check out CNA Financial for example). We show the entire calculation in full. You can track the result in your watchlist or portfolio and be alerted when this changes, or use our stock screener to discover 29 high quality undervalued stocks. If you save a screener we even alert you when new companies match - so you never miss a potential opportunity.
Next Steps
Mixed signals on CNA Financial so far. If you want to move before the next narrative shift, start with the full balance of 4 key rewards and 2 important warning signs.
Looking for more CNA Financial style investment ideas?
If you want more potential opportunities on your radar, use the Simply Wall St screener to surface fresh ideas before they move without you.
- Target steadier compounding potential by scanning a list of solid balance sheet and fundamentals (24 results) that can support dividends, reinvestment, and fewer balance sheet surprises when conditions get tougher.
- Hunt for mispriced quality by sorting through a 21 high quality undiscovered gems that combines strong fundamentals with limited current investor attention.
- Dial down portfolio stress and focus on durability by filtering a 30 resilient stocks with low risk scores built to highlight businesses with more resilient financial profiles.
Have feedback on this article? Concerned about the content? Get in touch with us directly. Alternatively, email editorial-team@simplywallst.com