


- Recent discussion on Peabody Energy focuses on higher output at the Centurion mine and supportive coal pricing as key drivers for future sales capacity and business performance.
- An interesting angle is the contrast between Peabody Energy's relatively low P/S ratio and concerns that the shares may still screen as expensive against more tailored industry benchmarks.
- This article examines how Peabody Energy's low price-to-sales ratio compared with sector peers may reshape the broader investment narrative today.
Scan beyond Peabody Energy and compare how other coal and resource producers with similar valuation debates stack up using our hand picked 29 high quality undervalued stocks.
Peabody Energy Investment Narrative Recap
To own Peabody Energy, you need to be comfortable with a coal producer that is currently unprofitable and highly tied to seaborne pricing and U.S. coal policy. The big near term swing factor is execution at Centurion and how quickly that mine can move toward its intended low cost, steady output profile without fresh technical issues.
In the short term, the recent focus on higher Centurion volumes and supportive coal prices does not remove the main risk. Commissioning problems already cut 2026 sales guidance and raised metallurgical cash cost guidance, while securities class actions and the broader shift toward renewables still hang over the longer demand picture.
The most relevant thread for this news flow is management’s previous Centurion guidance. That plan targeted around 4.7 million tons per year over 25 years at roughly US$105 per ton cash cost, on a first quartile cost curve. If achieved, this would increase Peabody Energy’s exposure to higher margin metallurgical coal.
Against that backdrop, any commentary about higher near term Centurion output and solid coal pricing sits alongside earlier cuts to 2026 sales guidance and higher cost assumptions. For you as a shareholder, the key questions are whether execution closes that gap, how quickly seaborne margins reflect the intended cost base, and how much legal and policy risk could offset those operational gains.
What The Peabody Energy Consensus Is Actually Pricing In
Peabody Energy's narrative projects US$4.8b in revenue and US$701.1m in earnings by 2029. To line up with that profile, analysts are assuming revenue growth of 6.5% per year and an earnings swing of about US$884m from a current loss of US$182.7m.
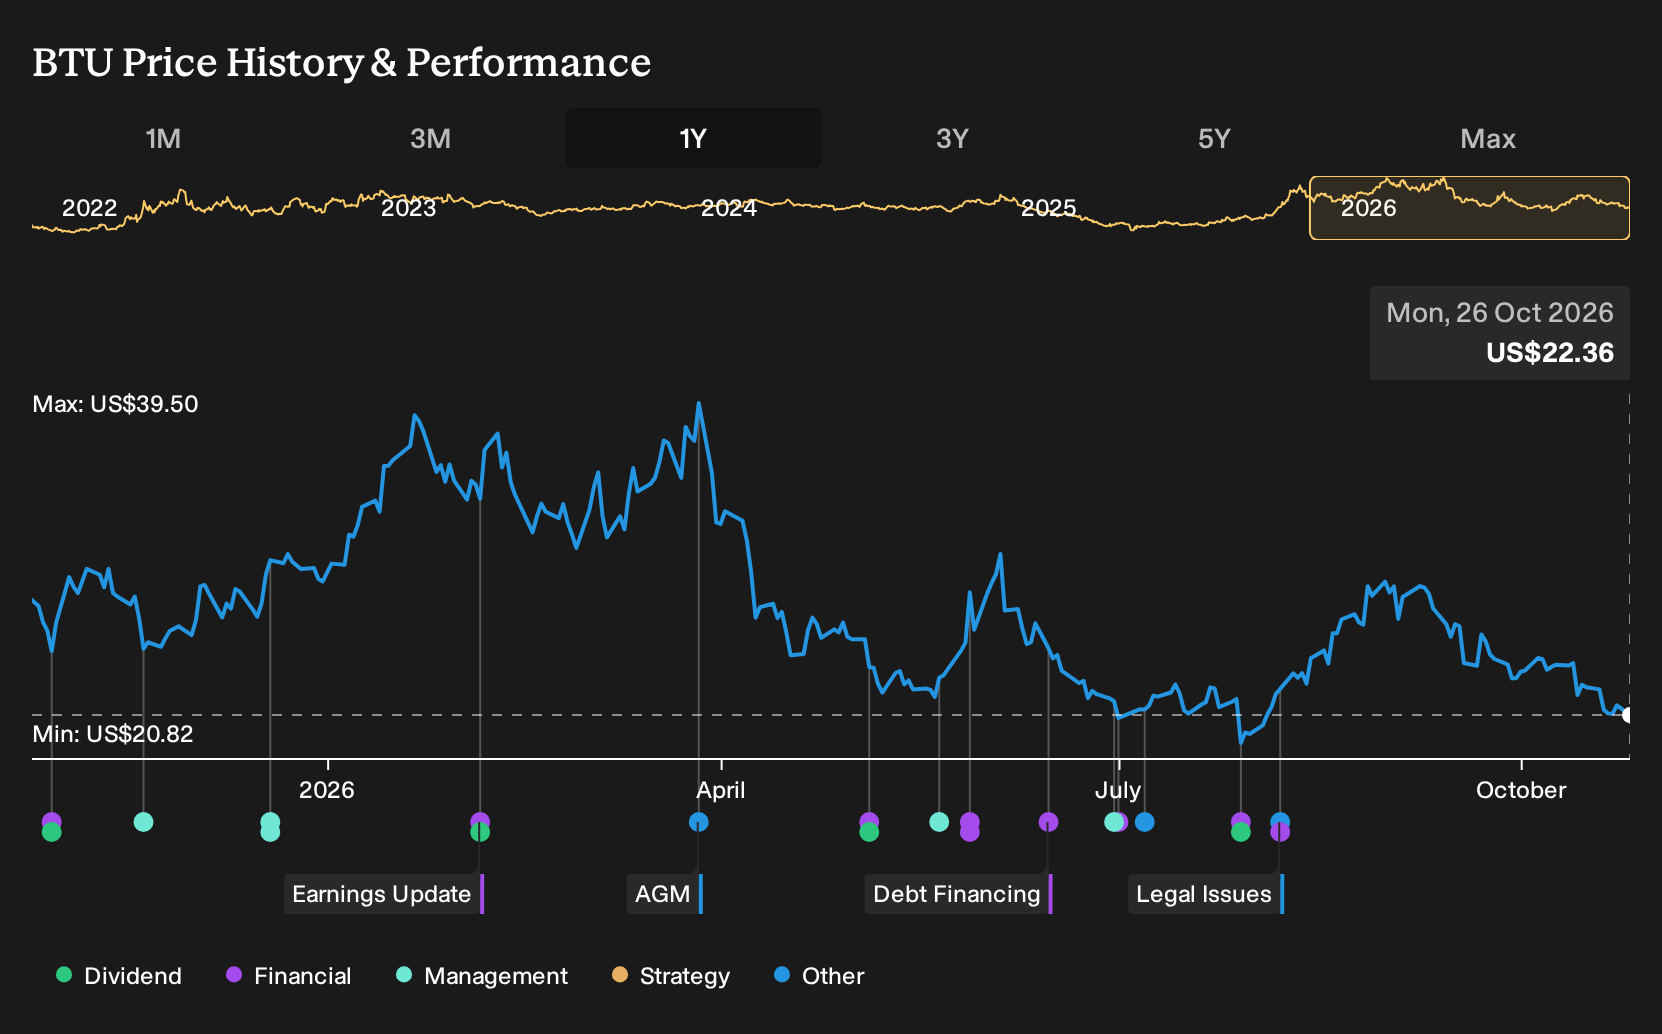
Uncover why Peabody Energy's fair value indicates a 41% potential upside to its current price that may not last much longer.
Exploring Other Perspectives
One alternate view on Peabody Energy leans heavily on coal demand risk. The most bearish analysts were only pencilling in about US$4.5b of revenue and US$482.6m of earnings by 2029 before this news, a clear step down from consensus. That gap shows how far opinions can stretch, so it is worth exploring both narratives before deciding how this update might shift your own view.
Explore 4 other Peabody Energy fair value estimates, including one that suggests it could be worth just $27.50!
Form Your Own Verdict
Don't just follow the ticker. Dig into the data and build a conviction that's truly your own.
- A great starting point for your Peabody Energy research is our analysis highlighting 3 key rewards that could impact your investment decision.
- See our latest analysis for Peabody Energy. The report includes a comprehensive fundamental analysis summarized in a single visual, the Snowflake, making it easy to evaluate Peabody Energy's overall financial health at a glance.
Looking for more investment ideas beyond Peabody Energy?
If you want to pressure test your view on Peabody Energy against other companies with different risk profiles, the Simply Wall St Screener can help you scan the market in a structured way instead of relying on headlines or hunches.
- For investors who care most about valuation and balance sheet strength, compare Peabody Energy with a list of solid balance sheet and fundamentals (24 results), where leverage and fundamentals are front and center.
- If resilience and smoother return profiles matter more to you than excitement, weigh this coal stock against a 30 resilient stocks with low risk scores that filters for lower risk scores.
- For those hunting for under-the-radar opportunities, broaden your watchlist with a 21 high quality undiscovered gems that surfaces lesser known companies with strong fundamentals.
Have feedback on this article? Concerned about the content? Get in touch with us directly. Alternatively, email editorial-team@simplywallst.com