


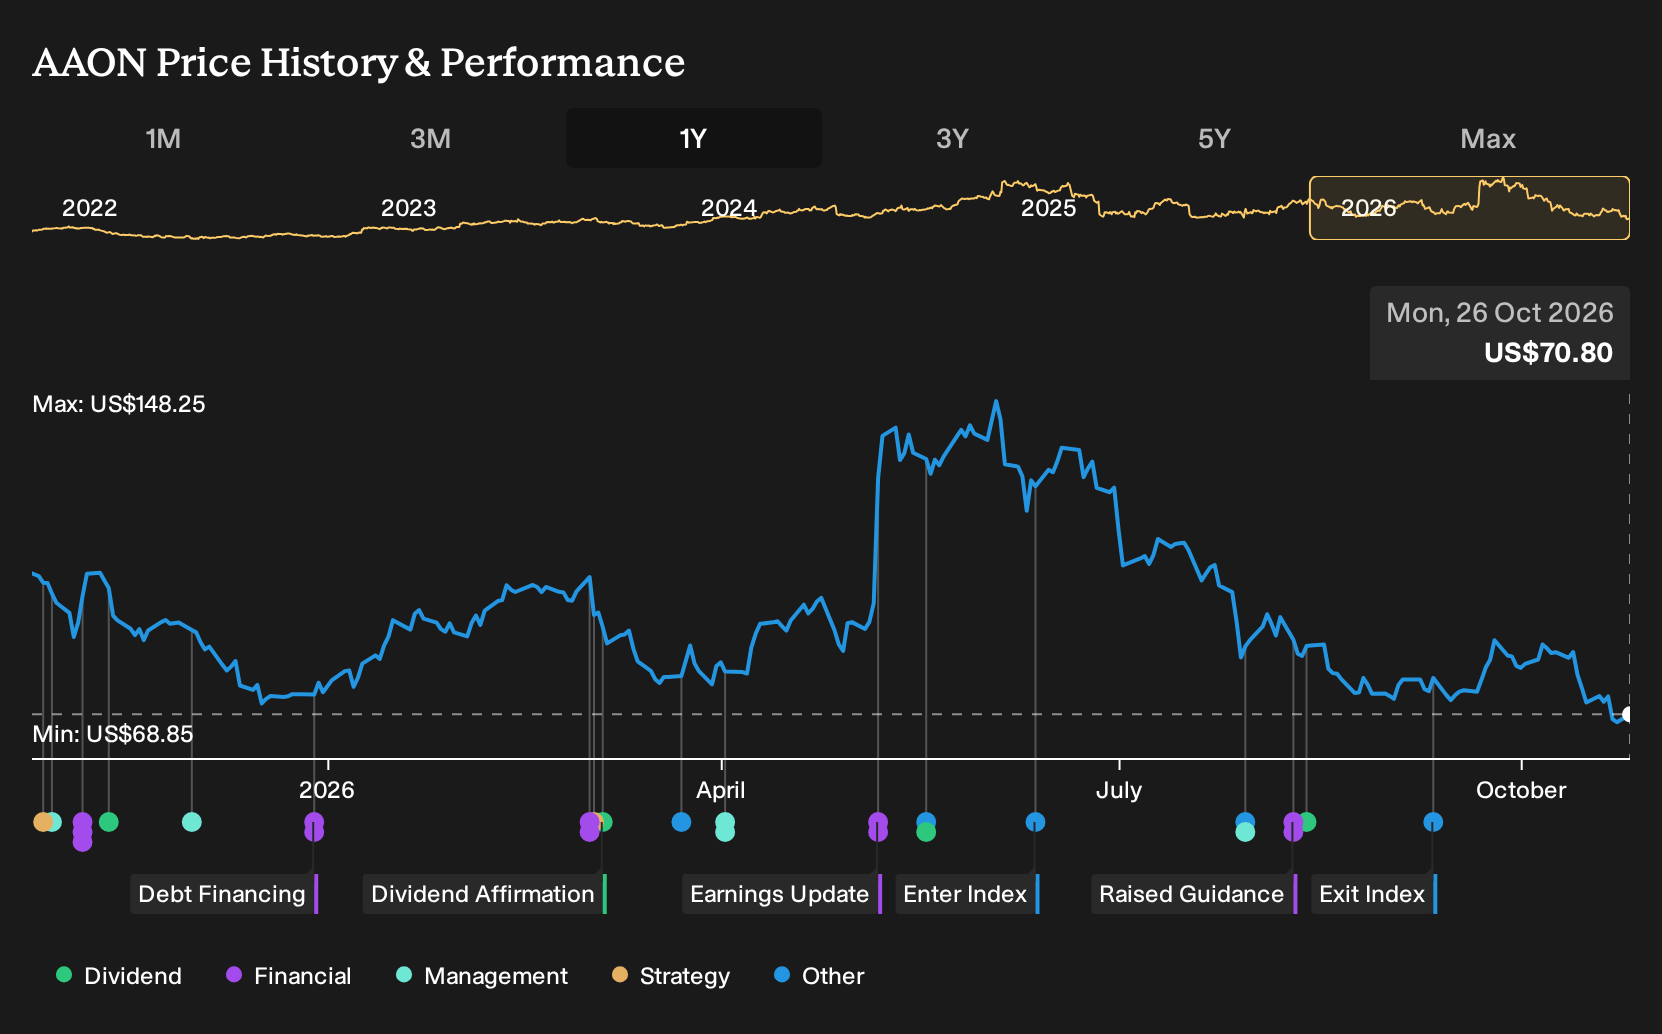
If you had looked at AAON in late October 2025 and decided to sit it out after seeing analysts split between a US$125 bull case and a US$90 bear case, the past 12 months might feel like a narrow escape. For AAON shareholders, the loss over the past year was 32.3%, including dividends. With that drop now on the scoreboard, which early warning signs or optimistic assumptions from those 2025 reports deserve the closest second look?
The useful thing about a Narrative is that the reasoning is checkable: the assumptions sit beside the argument, and together they imply an estimated Fair Value you can disagree with.
AAON is not the only name tied to this theme. Zero in on 55 AI infrastructure stocks and compare how each one is priced.
The Argument AAON Investors Actually Faced
The shares cost US$106 at the start of the period, and anyone looking at AAON then had to decide which story felt more convincing.
On the optimistic side, the June 2025 bull narrative put fair value at US$125, based on expectations that deep vertical integration, a record US$1 billion backlog, and exposure to high efficiency HVAC and data center cooling could support multi-year double-digit revenue growth and higher margins by 2028.
The June 2025 bear narrative set fair value at US$90, emphasizing risks from elevated costs at new facilities such as Memphis, dependence on a handful of large data center buyers, and heavier exposure to the North American non-residential cycle and regulatory pressures on refrigerants and emissions.
What The AAON Evidence Actually Tested
The clearest development for AAON was Q2 2026 results, where revenue reached US$627.0 million and net income rose to US$56.7 million, with net margin improving from 5.0% to 9.0%. That outcome supported the assumptions about backlog conversion and data center demand, although heavier capital spending and facility ramp issues in Memphis kept the bear case on execution risk alive. Overall, the evidence cut both ways.
The simple lesson is to track whether promised backlog and guidance turn into higher revenue and a healthier margin. For any similar stock, check reported backlog, actual sales, and the net margin line side by side each quarter to test the original story.
What You Would Be Paying For In AAON Today
AAON now trades at US$70.8, with this Narrative’s Fair Value sitting above that quote based on its own assumptions rather than any proven outcome.
The argument focuses on BASX data center growth, AAON branded HVAC share gains, and heavy investment potentially contributing to stronger margins and cash flow. For the share price decline to appear more like an opportunity than a warning, a buyer would need to believe that recent margin pressure will ease as the expanded platform scales.
"The main thing that has to go right is that AAON turns rapid BASX data center growth, AAON brand share gains, and heavy capex into sustained margin expansion and stronger free cash flow, despite recent gross margin pressure and historical negative free cash flow."
One Narrative has put a figure on that disagreement. → See the Narrative with its higher Fair Value, assumptions and all
Find Your Own Contrarian Opportunity
Passing on this one could have spared you a loss. Where might you find the opposite surprise? Start looking for companies whose prices leave room for a better outcome than investors expect. These three trade below our estimated value.
- Company 1 - 34% below our estimate - converts complex manufacturing contract wins into recurring programs across regulated customers.
- Company 2 - 40% below our estimate - expands coconut-based beverage volumes through branded retail channels and private label agreements.
- Company 3 - 35% below our estimate - broadens advisory mandates as capital markets and private transactions increase overall fee opportunities.
That is three of the list. See the full list of 29 companies trading below our fair value estimates →
Have feedback on this article? Concerned about the content? Get in touch with us directly. Alternatively, email editorial-team@simplywallst.com