


Strauss Group (TASE:STRS) is preparing a special call on 15 October 2026 to outline its 2027 to 2030 plan, a long-range update that could reshape how investors view the stock.
The recent pullback, with a 1 day share price return of down 5.25% to ₪115.5 and a 7 day share price return of down 2.70%, comes after a 1 month share price return of 3.59% and a year to date gain of 6.45%. Total shareholder return sits at 29.89% over 1 year and 70.78% over 3 years, which suggests long term holders in Strauss Group have seen stronger rewards even as short term momentum has cooled ahead of the 2027 to 2030 update.
Scan how Strauss Group stacks up against other consumer staples setting up for long term plans by sifting through our hand picked 223 resilient stocks with low risk scores.
Strauss Group has given recent buyers a wobble while long term holders still sit on strong gains. At ₪115.5, are you looking at remaining upside, or a story where most of the easy return is already behind it?
Preferred P/E of 22.1x: Is it justified for Strauss Group?
Strauss Group trades on a P/E of 22.1x, which prices the stock well above the broader Asian Food industry while still sitting below closer peers.
The P/E ratio compares the current share price to earnings per share and gives you a quick sense of how much investors pay for each unit of profit. For a consumer staples business like Strauss Group, where demand often leans toward everyday spending rather than big cycles, this measure is a common way to benchmark expectations for future profitability.
Here the picture is mixed. Earnings have grown by 6.7% per year over the past 5 years, yet profit fell 4.4% over the past year and net profit margins moved down from 8.6% to 7.8%. That combo suggests the market is paying a premium multiple while recent profitability trends have softened, which can mean investors are willing to look through near term pressure.
Compared with the Asian Food industry average P/E of 14.4x, Strauss Group trades on a much richer multiple, which implies the market is valuing its earnings more highly than many regional peers. Against a peer group average of 28.1x, the same 22.1x P/E looks lower, so relative to that set of stocks the pricing looks more restrained even if it is not cheap in absolute terms.
See what the numbers say about this price — find out in our valuation breakdown.
Result: Price-to-earnings of 22.1x (OVERVALUED).
Still, the premium P/E leaves little room for disappointment if Strauss Group faces weaker consumer demand or pressure on its already tight net profit margins.
Find out about the key risks to this Strauss Group narrative.
Another View: Our DCF model paints a very different picture for Strauss Group
The SWS DCF model points in the opposite direction to the P/E story. At ₪115.5, Strauss Group trades well above an estimated future cash flow value of ₪35.55, which flags the shares as expensive on this cash based yardstick and raises a simple question: Which signal should you trust more?
Look into how the SWS DCF model arrives at its fair value.
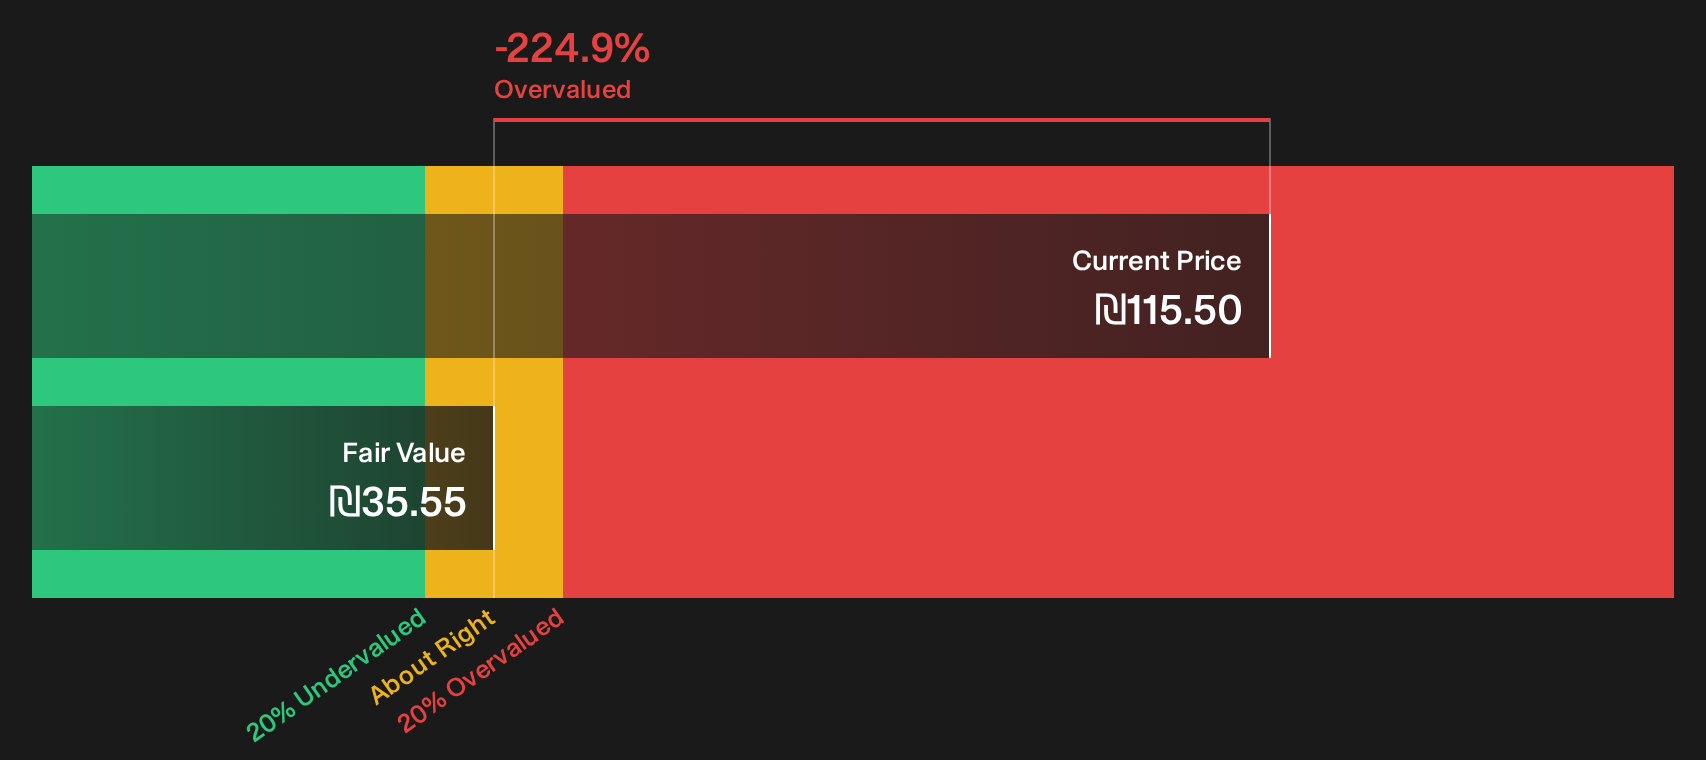
Simply Wall St performs a discounted cash flow (DCF) on every stock in the world every day (check out Strauss Group for example). We show the entire calculation in full. You can track the result in your watchlist or portfolio and be alerted when this changes, or use our stock screener to discover 195 high quality undervalued stocks. If you save a screener we even alert you when new companies match - so you never miss a potential opportunity.
Next Steps
If the signals on Strauss Group feel conflicted, that is the point. It is exactly why you should check the details yourself before reacting. To see what is worrying some investors, review the 1 important warning sign.
Looking for more Strauss Group investment ideas?
If Strauss Group has you thinking harder about quality and valuation, do not stop here. The right watchlist today could shape your next decade of returns.
- Target resilient balance sheets by filtering for companies in the list of solid balance sheet and fundamentals (207 results).
- Surface potential bargains early by reviewing the 195 high quality undervalued stocks.
- Build a cash flow focused watchlist by scanning the 224 dividend fortresses.
Have feedback on this article? Concerned about the content? Get in touch with us directly. Alternatively, email editorial-team@simplywallst.com