


Cheniere Energy Partners (CQP) is back in focus after its parent outlined expansion plans for the Sabine Pass Liquefaction Project, targeting up to 20 mtpa of additional LNG capacity.
Cheniere Energy Partners has seen momentum build, with a 7 day share price return of 4.15% and a 30 day gain of 4.48% taking the stock to $66.27. Long term total shareholder returns of 31.15% over 1 year and 110.47% over 5 years reflect a solid payoff for investors factoring in its regular distributions.
Scan Cheniere Energy Partners alongside other income-focused infrastructure plays by reviewing our hand picked list of 5 dividend fortresses for potential distribution resilience and pricing power.
Bulls point to Cheniere Energy Partners’ expansion plans and fresh distribution as support for today’s price. Bears see stretched expectations after the recent climb. Which side does the current valuation favor?
Price-to-Earnings of 12x: Is it justified?
On recent pricing, Cheniere Energy Partners changes hands at a P/E of 12x, which screens as good value against both peers and the wider US market.
The P/E ratio compares the current share price to earnings per unit, so it effectively shows how many dollars investors are paying for each dollar of profit. For a business like Cheniere Energy Partners, where earnings are a key focus for income oriented holders, this yardstick gives a quick read on how the market is weighing its LNG cash generation.
Relative to the US Oil and Gas industry average P/E of 12.5x and a peer group closer to 21.5x, the current 12x multiple looks restrained. The estimated fair P/E of 14.6x also sits above today’s level, which points to a market that is pricing earnings more cautiously than those benchmarks and leaves room for sentiment to move toward that fair ratio.
Explore the SWS fair ratio for Cheniere Energy Partners.
Result: Price-to-Earnings of 12x (UNDERVALUED)
Still, the Cheniere Energy Partners story faces pressure points, including declining annual net income growth and reliance on a single LNG terminal and pipeline system.
Find out about the key risks to this Cheniere Energy Partners narrative.
Another view on Cheniere Energy Partners’ value
The P/E picture looks friendly, but the SWS DCF model paints something closer to a warning label. At a unit price of $66.27 and an estimated future cash flow value of $2.42, Cheniere Energy Partners comes through as heavily overvalued on this approach. Which lens should carry more weight for you?
Before leaning on the earnings multiple alone, it can help to understand how the cash flow model gets to such a different answer. Look into how the SWS DCF model arrives at its fair value.
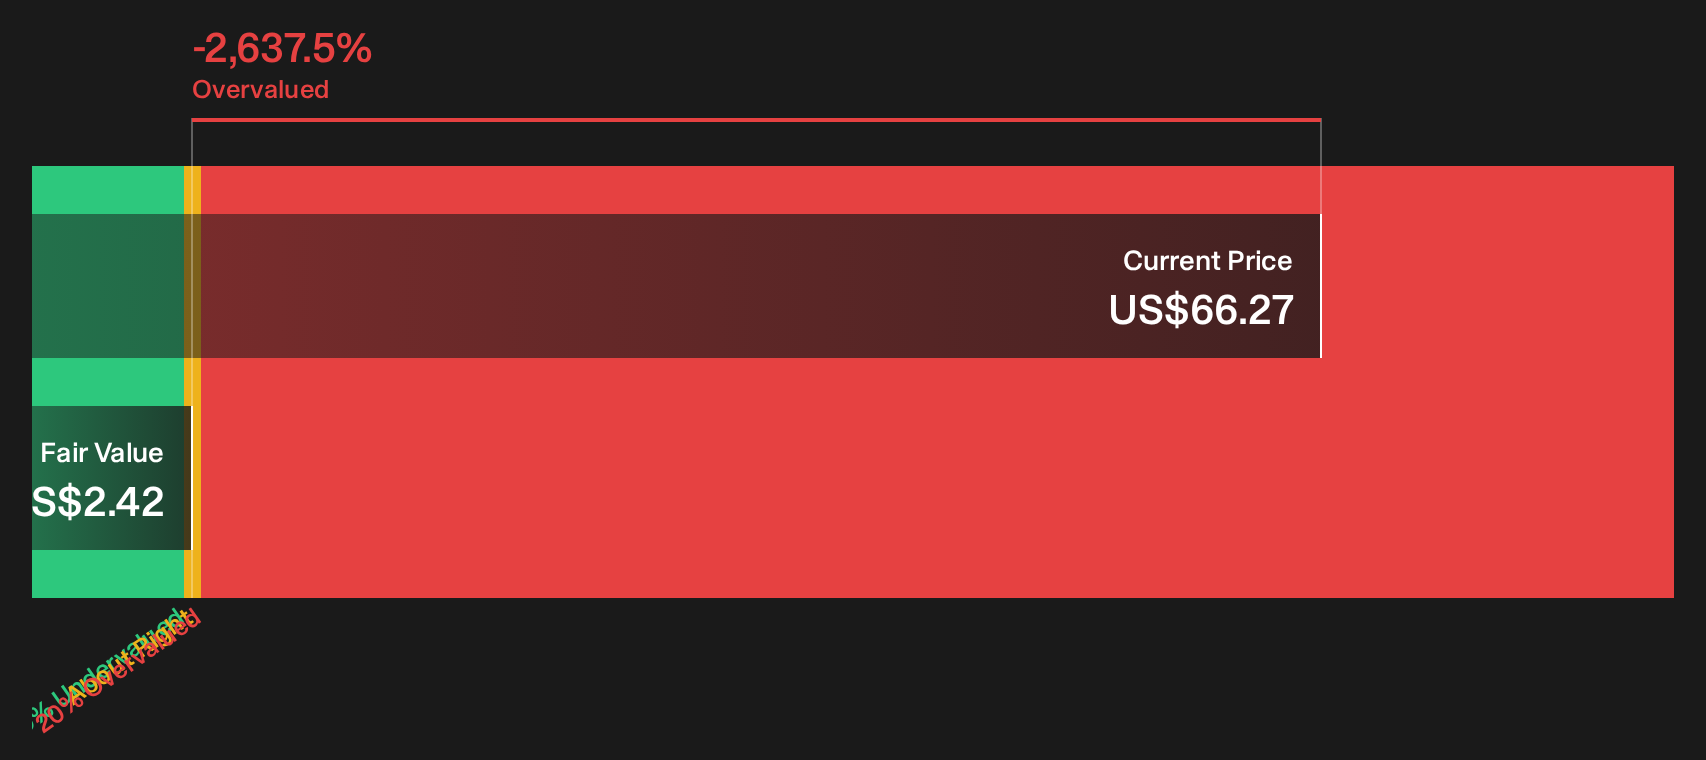
Simply Wall St performs a discounted cash flow (DCF) on every stock in the world every day (check out Cheniere Energy Partners for example). We show the entire calculation in full. You can track the result in your watchlist or portfolio and be alerted when this changes, or use our stock screener to discover 29 high quality undervalued stocks. If you save a screener we even alert you when new companies match - so you never miss a potential opportunity.
Next Steps
If the mixed signals around Cheniere Energy Partners leave you torn, that is exactly why checking the underlying data yourself matters right now so you can decide where you stand on its balance of potential upside and downside and review the 3 key rewards and 3 important warning signs
Looking for more investment ideas beyond Cheniere Energy Partners?
Do not stop at Cheniere Energy Partners. Use the Simply Wall St screener to quickly spot fresh ideas that match your income, risk and value priorities.
- Target dependable income by reviewing the 5 dividend fortresses that combine higher yields with fundamentals you can actually inspect.
- Sharpen your value hunt with the 29 high quality undervalued stocks that highlight companies trading below their assessed worth.
- Dial down portfolio stress by scanning the 30 resilient stocks with low risk scores that focus on resilient businesses with more modest risk profiles.
Have feedback on this article? Concerned about the content? Get in touch with us directly. Alternatively, email editorial-team@simplywallst.com