


Bladex shares slipped about 2% today to US$52.18 after the bank posted its Q3 2026 scorecard. Traders focused on the red on their screens. Longer term investors will likely be looking somewhere else entirely.
The headline is simple. Bladex delivered strong profitability anchored by a record US$15b commercial portfolio and US$79.8m in net interest income, while keeping credit quality tight and capital cushions healthy. The short term move looks cautious. The multi year picture turns on whether this level of earnings power and balance sheet strength proves durable.
Like the earnings power at Bladex but want a broader set of banks and lenders with solid cushions and loan books that aim for a similar balance of income and risk control? Scan the list of solid balance sheet and fundamentals stocks (24 results)
Q3 2026 Earnings Summary
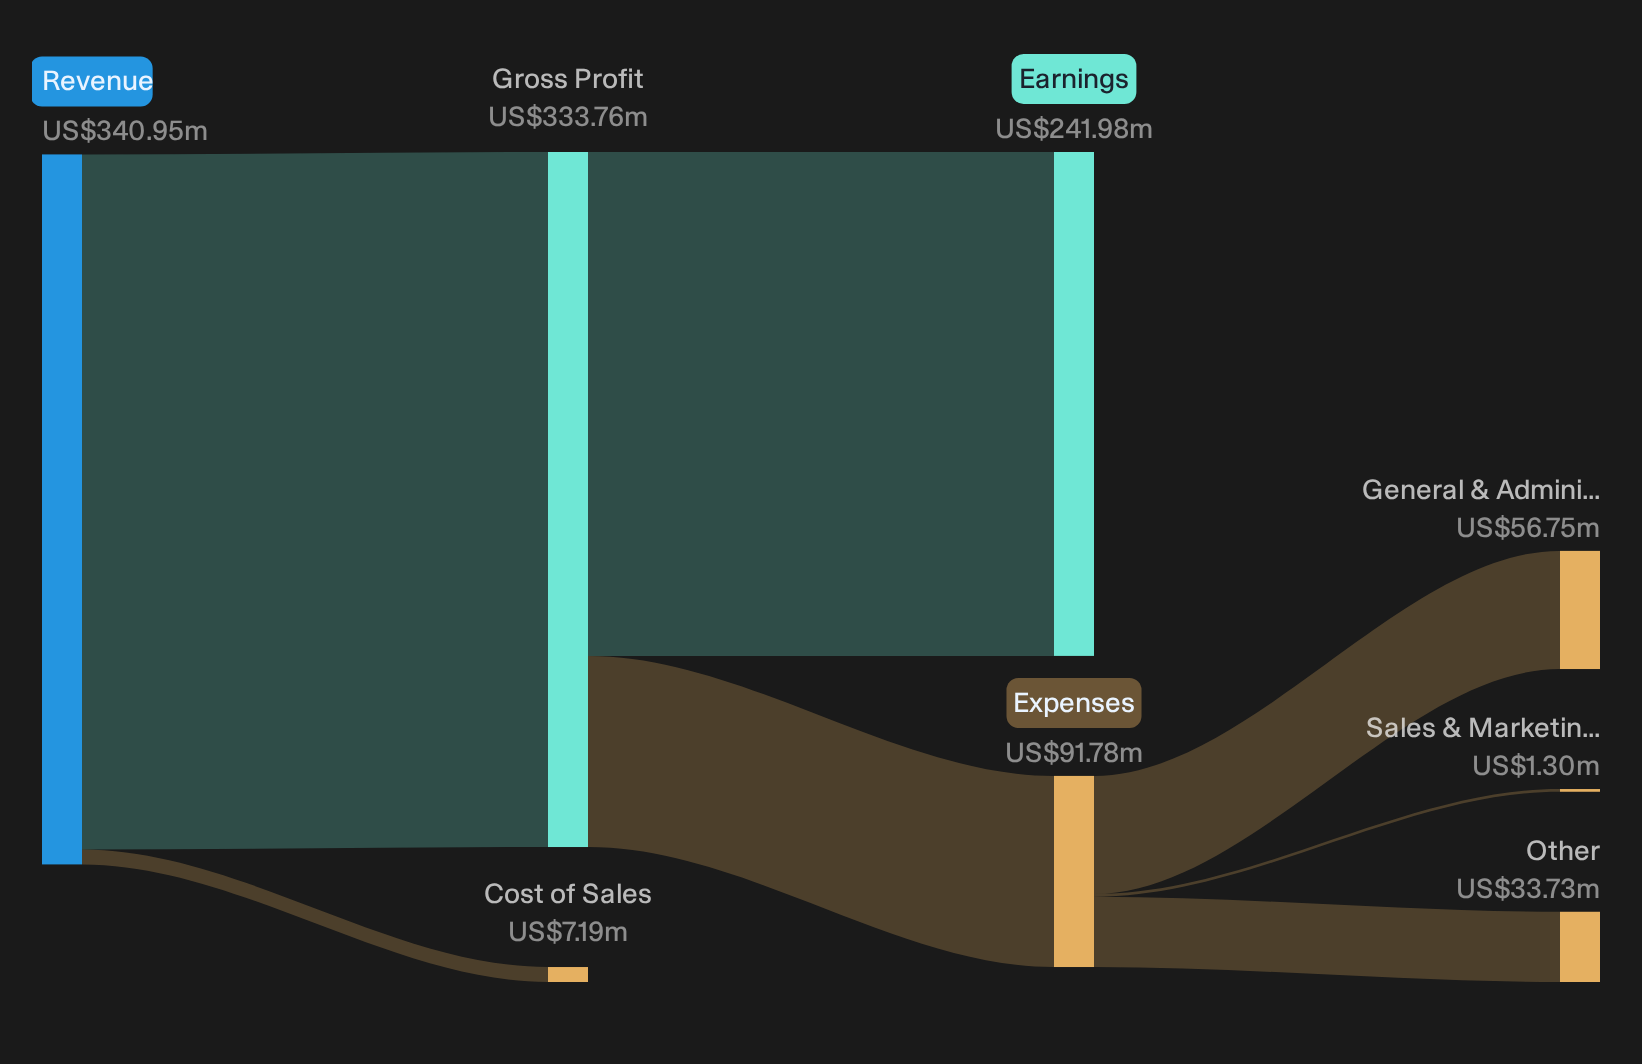
- Total Revenue (Q3 2026 vs. Q3 2025): US$88.8m vs. US$76.3m (higher year on year)
- Net Income excl. Extra Items (Q3 2026 vs. Q3 2025): US$63.2m vs. US$55.0m (higher year on year)
- Basic EPS (Q3 2026 vs. Q3 2025): US$1.48 vs. US$1.48 (broadly unchanged year on year)
- Net Profit Margin, Trailing 12 Months (2026 vs. 2025): 71.0% vs. 72.1% (slight compression)
Ask Charlie what Bladex’s one-off Panama loan changes for 2027.
Bladex Bull Case: Fee Ambition Meets Early Evidence
The optimistic view on Bladex hinges on richer fee streams and a sturdier funding mix, not just a bigger loan book.
"Bullish analysts expect Bladex to keep building on record non interest income and expanding fee based products, so that a larger share of revenue comes from letters of credit, syndications, commitments, and client derivatives alongside interest income."
Q3 moves this story forward in measurable ways. Noninterest income reached US$19.0m and held roughly a fifth of revenue. Letters of credit hit record levels and 13 structured deals were completed year to date, which aligns with the idea of deeper fee pipelines. Client derivatives remain small but are moving in the right direction.
The price and this Narrative do not agree. → Uncover what this Narrative says Bladex is actually worth.
Bladex Bear Case: Margin Strain Still Lurking Beneath Growth
Concern around Bladex centers on whether fee expansion can keep earnings from leaning too hard on a pressured net interest margin.
"Although Bladex is growing fee based activities such as syndications and client derivatives, the recent decline in net interest margin to 2.24% as liquidity stays elevated suggests these newer income streams may not expand fast enough to offset weaker lending spreads."
Q3 offers mixed evidence. Reported NIM ticked to 2.30%, helped by accelerated fee recognition. However, management still guides to about 2.25% for 2026, essentially flat to slightly softer. Noninterest income reached US$19.0m and about 19% of revenues, which supports diversification but does not clearly outpace the margin drag that bearish investors worry about.
Hunt For Mispriced Earnings Power
Bladex reports a solid quarter that still leaves some investors cautious in the short term. The real opportunity is finding stocks that could be undervalued before the market reassesses their earnings power.
- Company 1 - 18% below our estimate - leans into AI-focused data center optics contracts as expanded manufacturing capacity shifts toward higher value photonics and packaging work.
- Company 2 - 42% below our estimate - adds new emerging market corridors for large merchants as higher margin payment products and automation reshape take rates on rising transaction volumes.
- Company 3 - 34% below our estimate - builds AI superclusters on a newer cloud infrastructure stack as a headline partnership channels demanding generative workloads onto its data centers.
That is three of the list. See the full list of 29 companies trading below our fair value estimates →
Have feedback on this article? Concerned about the content? Get in touch with us directly. Alternatively, email editorial-team@simplywallst.com