


American Tower just delivered Q3 2026 results and the stock fell 2.4% to US$183.83 by the close. The move looks driven more by mood than math. This is a real estate investment trust, so the heartbeat is Funds From Operations and adjusted funds per share, not headline earnings. Attributable adjusted funds per share guidance now points to more than 3% full year growth, with management again lifting property and data center revenue targets. That is a curious setup for a red day, and it sets the stage for a closer look at what traders chose to focus on.
Like the income profile and steady FFO grind from American Tower but uneasy when the price reaction seems driven by mood instead of fundamentals? Compare this setup with our screener of solid cash generators in the list of solid balance sheet and fundamentals stocks (24 results).
Q3 2026 Earnings Summary
- Total Revenue (Q3 2026 vs Q3 2025): US$2,785.4m vs. US$2,717.4m (up 2.5%)
- Net Income (Excl. Extra Items) (Q3 2026 vs Q3 2025): US$765.8m vs. US$853.3m (down 10.3%)
- Basic EPS (Q3 2026 vs Q3 2025): US$1.65 vs. US$1.82 (down 9.7%)
- Funds From Operations (FFO) (Q3 2026 vs Q3 2025): US$1,249.3m vs. US$1,262.1m (down 1.0%)
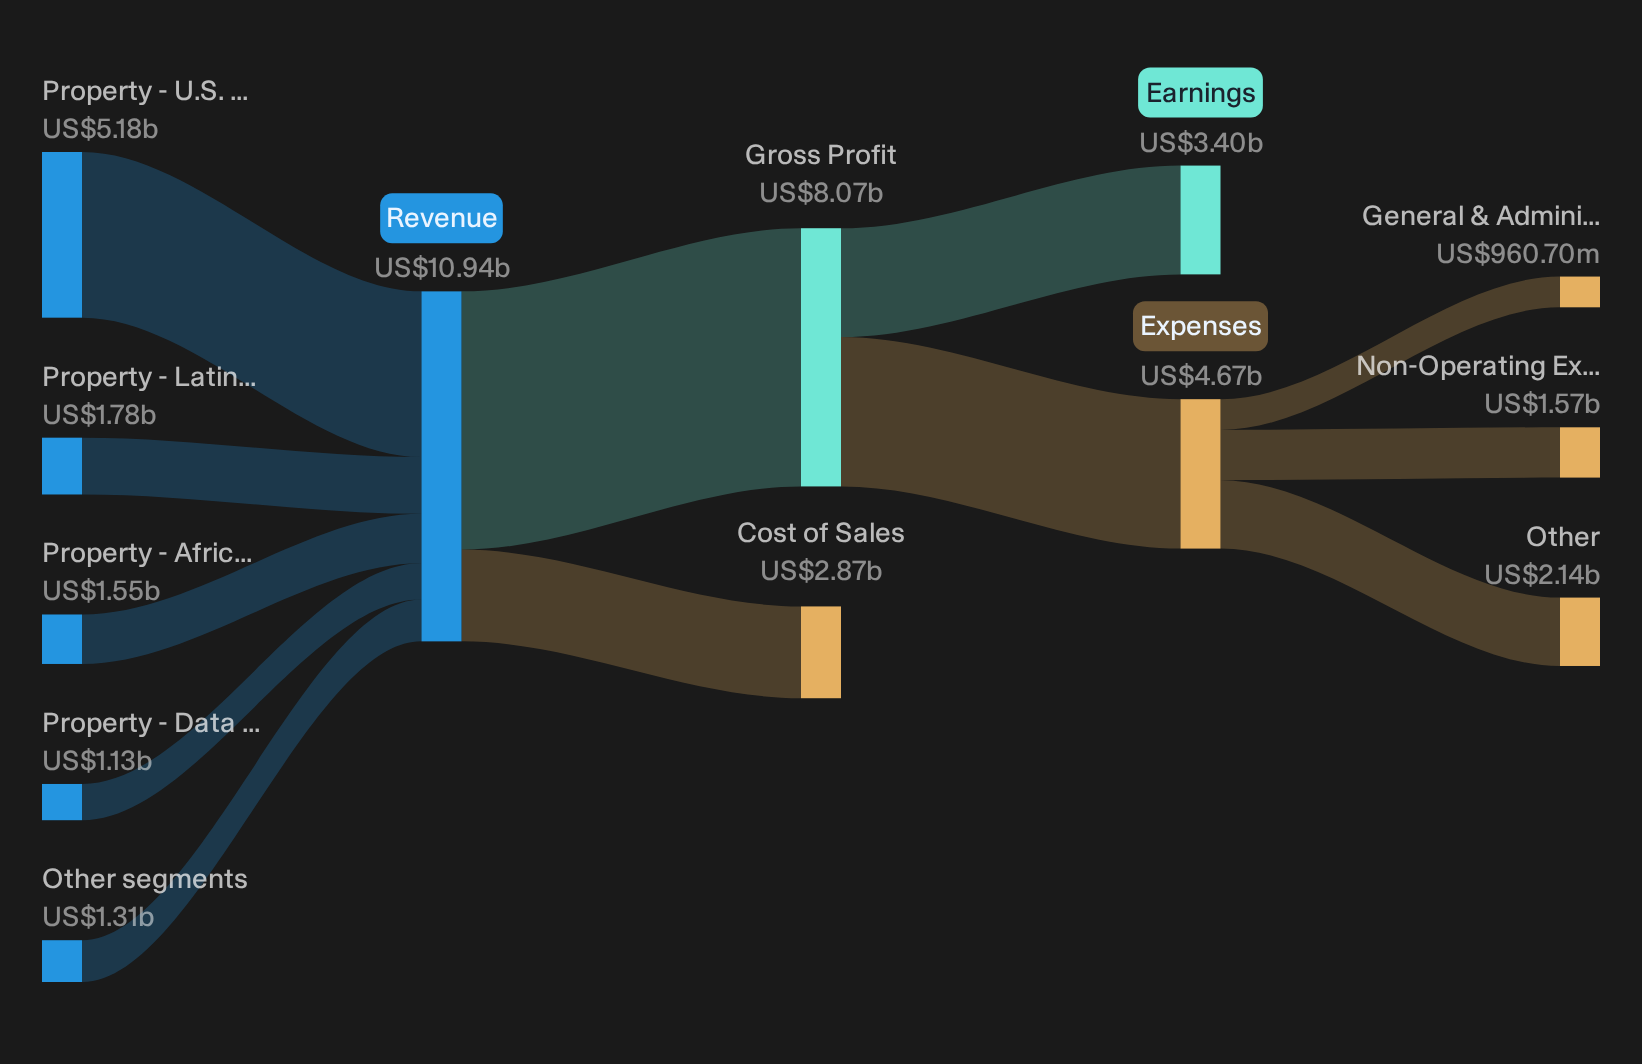
American Tower’s Growth Engine, Tested Against Q3
The bullish story hinges on American Tower turning tower scale into expanding cash flow per site.
"The business is long-established and capital intensive at the start, but once a tower is built, each additional tenant adds revenue at very little extra cost."
Q3 shows that engine working, but not firing on all cylinders. Property revenue grew about 5% and closer to 7% after backing out one time DISH churn. Data center cash revenue climbed about 16%. AFFO per share guidance now implies more than 3% growth and closer to 6% on a normalized basis. Operating leverage is present, just softened by churn and services pressure.
Rate, Churn, And FX Risks In The Numbers
The bear story focuses on financing costs and customer churn dragging on that same cash engine.
"Further rate increases or tighter credit could pressure REIT valuations and refinancing costs. Carrier consolidation or slower network spending could slow leasing growth. Currency effects on international towers can also hit reported results."
Higher interest expense is visible in the modest 1% FFO decline despite revenue growth, and refinancing costs clip normalized AFFO. One time DISH churn trims roughly 400 bps from organic tenant billings. Latin America property trends lag, with Brazil churn pulling the region down 2%. FX is explicitly called out in guidance, with growth stronger on an FX neutral and churn adjusted basis than in reported figures.
One Narrative disagrees with today's price. → See where this Narrative says American Tower should trade.
Hunt Valuation Gaps Before They Close
American Tower just showed how sentiment can move faster than the quarterly math. The real opportunity is finding stocks that could be undervalued before the market corrects them.
- Company 1 - 46% below our estimate - convert an extensive backlog of large infrastructure projects into long term cash.
- Company 2 - 23% below our estimate - build a cloud and productivity ecosystem that integrates AI into daily workflows.
- Company 3 - 42% below our estimate - expand a coconut based drinks platform across branded and private label retail channels.
Three companies from the same screener. Open all 29 potentially undervalued companies →
Have feedback on this article? Concerned about the content? Get in touch with us directly. Alternatively, email editorial-team@simplywallst.com