


Silvercorp Metals (TSX:SVM) drew fresh attention after reporting materially lower production and sales of silver, gold, lead, and zinc for the quarter and six months ended September 30, 2026, compared with a year earlier.
The production setback has landed in a tough stretch for Silvercorp Metals, with the share price down 24.47% over the past month and 5.69% over the last 90 days. However, the 1-year total shareholder return of 38.51% and the very large 3-year total shareholder return of about 3x show that longer term holders have still seen strong gains.
Scan beyond Silvercorp Metals and compare this production slump with other miners by checking which producers make the cut in our hand-picked 10 top silver producer stocks
Silvercorp Metals has dropped hard on weaker volumes, yet the longer term track record still sits in the green. Has this pullback already used up most of the upside, or is valuation still on your side?
Price-to-Earnings of 60.9x: Is it justified?
Valuation on Silvercorp Metals is currently framed by a rich P/E of 60.9x, a level that sits well above many peers even after the recent share price pullback from CA$12.10.
The P/E ratio compares the current share price with the last 12 months of earnings per share. For a miner like Silvercorp Metals, this multiple reflects what the market is willing to pay today for each dollar of recent profit, which can be heavily influenced by commodity cycles, volume swings, and expectations for future earnings.
At 60.9x, the market is paying nearly three times the peer average of 21.4x and more than four times the broader Canadian Metals and Mining industry average of 14.2x. The estimated fair P/E of 28.2x is also less than half of where the shares trade. This points to a valuation level that would need a strong earnings ramp to look more aligned with peers and the fair ratio the SWS model suggests markets could move toward.
Explore the SWS fair ratio for Silvercorp Metals.
Result: Price-to-Earnings of 60.9x (OVERVALUED)
Still, the rich P/E sits alongside lower recent production, and Silvercorp Metals remains fully tied to a single country for all of its revenue.
Find out about the key risks to this Silvercorp Metals narrative.
Another View on Silvercorp Metals Valuation
The rich P/E story is only half the picture. Our DCF model values Silvercorp Metals at CA$49.06 per share based on estimated future cash flows, compared with the current CA$12.10 price. That points to a stock our DCF model sees as significantly undervalued. Which signal deserves more weight in your process?
Look into how the SWS DCF model arrives at its fair value.
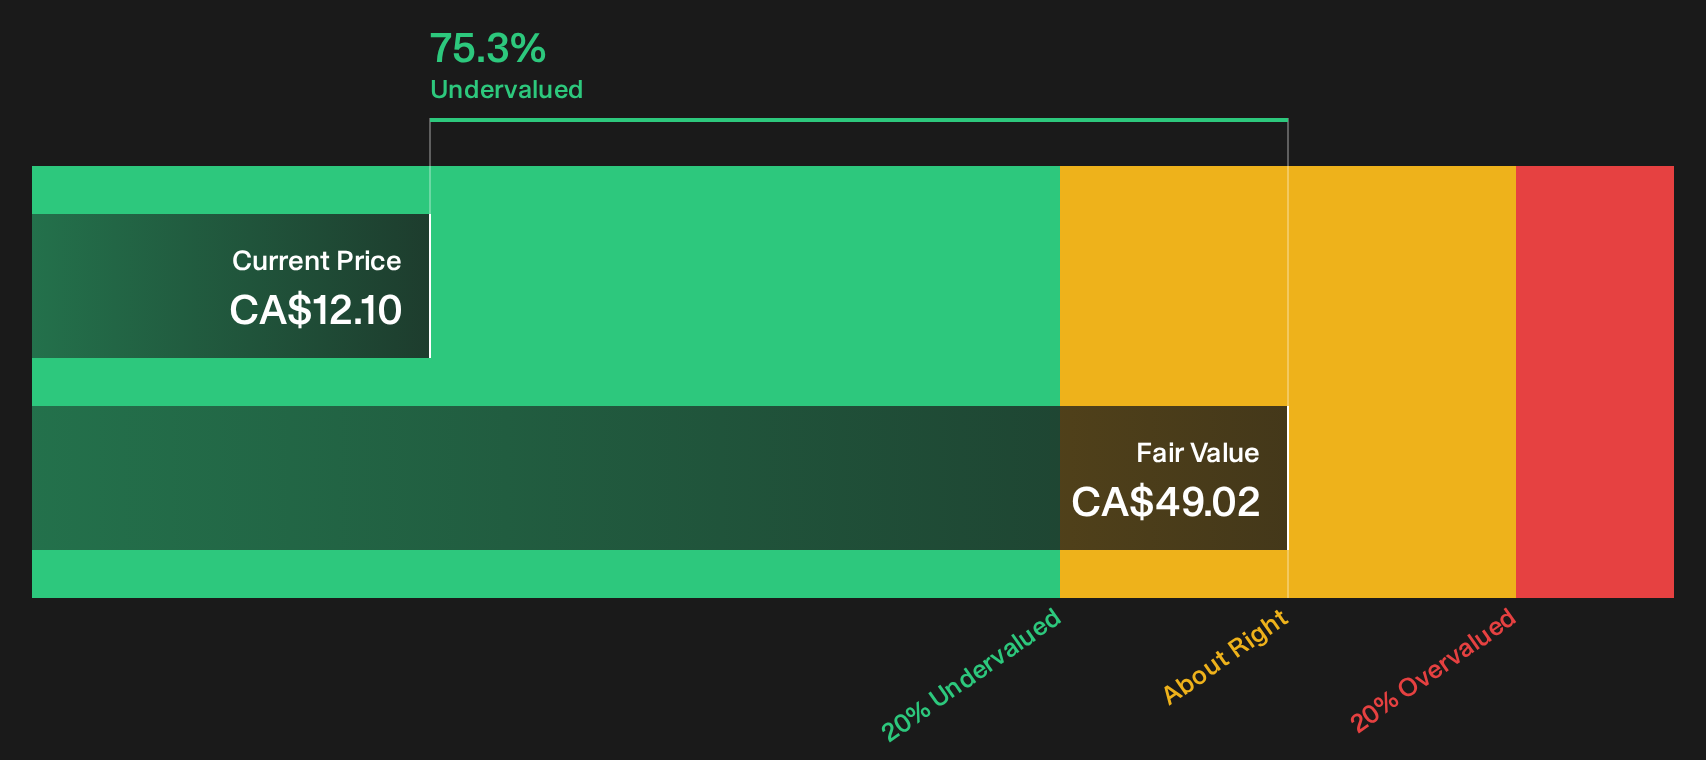
Simply Wall St performs a discounted cash flow (DCF) on every stock in the world every day (check out Silvercorp Metals for example). We show the entire calculation in full. You can track the result in your watchlist or portfolio and be alerted when this changes, or use our stock screener to discover 3 high quality undervalued stocks. If you save a screener we even alert you when new companies match - so you never miss a potential opportunity.
Next Steps
Mixed signals on Silvercorp Metals often create as many questions as answers, so move quickly, review the underlying data, and weigh the 3 key rewards and 3 important warning signs.
Ready for more ideas beyond Silvercorp Metals?
Do not stop with just Silvercorp Metals. Put the data on your side and line up a few more potential candidates using the Simply Wall St screener tools.
- Target quality at a discount by scanning our hand picked 3 high quality undervalued stocks that pair strong fundamentals with prices the market has not fully embraced.
- Focus on resilience and sleep easier by filtering for 8 resilient stocks with low risk scores where balance sheets and risk profiles aim to limit nasty surprises.
- Spot potential future leaders early by checking the 9 high quality undiscovered gems before they appear on everyone else's radar.
Have feedback on this article? Concerned about the content? Get in touch with us directly. Alternatively, email editorial-team@simplywallst.com