


Flex (FLEX) heads into its next earnings release with expectations for quarterly earnings of US$1.05 per share and revenue growth of 20.2%, as investors gauge how sector momentum might influence the stock.
Flex’s recent price action has been choppy, with an 8.26% 1 day share price return following a 30 day share price decline of 27.32%. However, the longer term total shareholder return of 551.06% over five years points to strong historical compounding despite the latest pullback.
Scan how Flex compares to other manufacturing and electronics plays by reviewing our hand picked 94 robotics and automation stocks that are riding similar supply chain and automation trends.
Bulls see the recent drop as a reset for a US$28.4b manufacturing platform tied to automation and data centers. Bears focus on cyclicality and execution risk. Which story does Flex’s current valuation lean toward?
Most Popular Narrative: 36% Undervalued
Flex closed at $83.35, while the most followed narrative pegs fair value at $130.26, so the gap between price and story is wide and very visible.
Flex’s operational transformation has reached an inflection point over the past six months. Driven by explosive demand for AI data center hardware and power management, the company is translating structural tailwinds into record financial performance.
See why 6 investors see Flex as 36% undervalued.
Result: Fair Value of $130.26 (UNDERVALUED)
Still, two pressure points could puncture the Flex story for a while: any stumble on the CPI spin off timeline and weaker AI data center orders.
Find out about the key risks to this Flex narrative.
Another View: Flex Through a Cash Flow Lens
While the leading Flex narrative leans on a $130.26 fair value, the SWS DCF model paints a very different picture. On future cash flows alone, it points to a fair value of $39.77, which makes the current $83.35 share price look expensive rather than cheap.
That kind of gap can signal either generous expectations built into the price or a model that is too cautious about long term profitability and reinvestment. For an investor weighing both stories, the question is simple: Which set of assumptions about Flex feels more realistic?
Look into how the SWS DCF model arrives at its fair value.
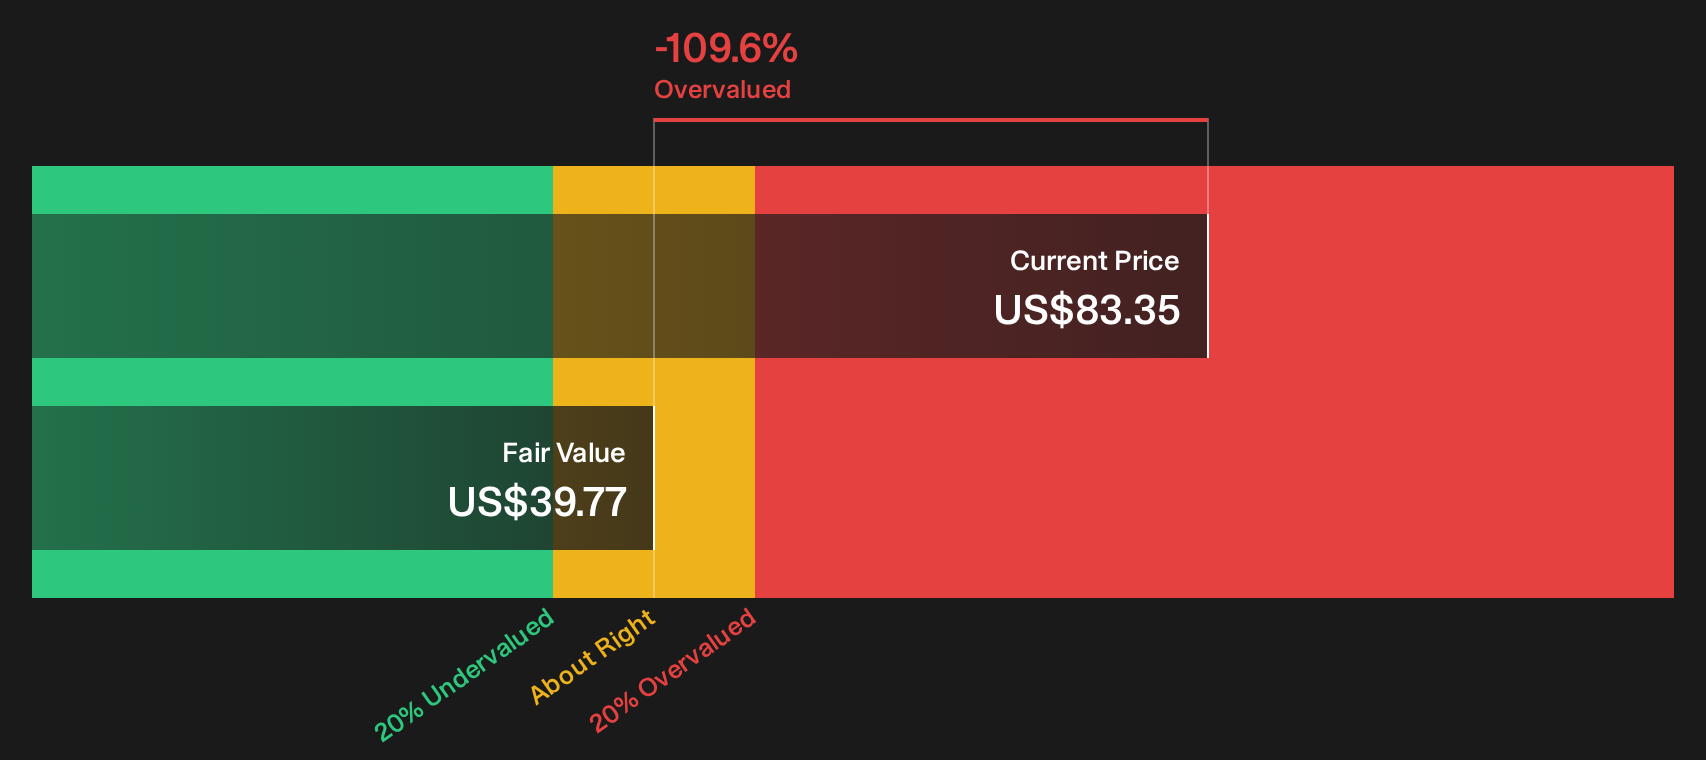
Simply Wall St performs a discounted cash flow (DCF) on every stock in the world every day (check out Flex for example). We show the entire calculation in full. You can track the result in your watchlist or portfolio and be alerted when this changes, or use our stock screener to discover 29 high quality undervalued stocks. If you save a screener we even alert you when new companies match - so you never miss a potential opportunity.
Next Steps
The split between Flex bulls and bears is clear. Consider this your cue to move quickly, test the numbers yourself, and decide which camp you lean toward by reviewing the 3 key rewards and 1 important warning sign.
Looking for more investment ideas beyond Flex?
If Flex has you weighing different stories, broaden your playbook with a few focused screens designed to surface new companies that match your style.
- Target potential mispricings by scanning a curated set of 29 high quality undervalued stocks that pair strong fundamentals with more modest expectations.
- Prioritize resilience by reviewing a list of solid balance sheet and fundamentals (24 results) when you want sturdier finances behind the share price.
- Hunt for future leaders early and sift through a 21 high quality undiscovered gems before the wider market starts paying attention.
Have feedback on this article? Concerned about the content? Get in touch with us directly. Alternatively, email editorial-team@simplywallst.com